
Inside The Stock Market ...trends, cross-currents, and outlook
2017 Was A Good Year For Playing The Bounce

The last two months of 2017 produced great results for the Bounce strategy.
Not A Tipping Point, But A “Toggle” Point?
Evidently, being a bull in a bull market is no longer good enough.
Stock Market Observations

Economic and momentum considerations have kept us mostly aboard this bull for much longer than our value-seeking inner selves would have otherwise allowed.
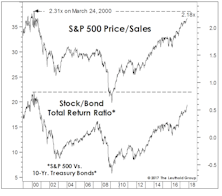
Value: Scarcer Than In 2000
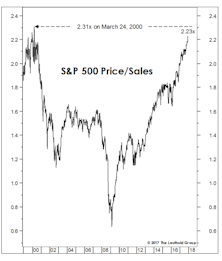
Comparing current valuations to March 2000 is unfair to March 2000. Any Value or Small Cap manager from that era can attest that values became more plentiful as the S&P ascended into its narrow peak.
The “Gap” Is Gone. Now What?
In Q3, the CBO’s Nominal Output Gap swung to positive for the first time since the last business cycle peak. This type of move has historically meant the cyclical peak in profit margins is close at hand.
The ISM: Good News Is Still Good News
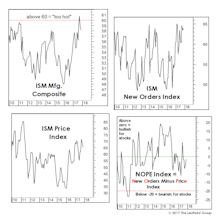
November’s report might have been lifted verbatim from the Goldilocks playbook, with the reading very strong but below the 60 level that we’ve statistically shown to be a threshold where “good news becomes bad news” for the stock market.
The Chart The Fed Forgot
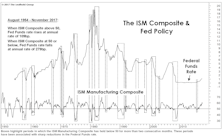
The Fed has long claimed itself to be “data dependent” while providing less and less information on those data points it considers most relevant. We can’t know what’s on that list, but we certainly know what isn’t: the ISM Manufacturing Composite, which (prior to the current cycle) provided an excellent gauge of the Fed’s policy bias.
Seasonality And Market Breadth
While the FANGs—and, lately, the Dow stocks—are the market’s undisputed leaders, it’s difficult to argue the market has narrowed in a fashion that’s indicative of a “distribution” phase.
Sector Rotation: Momentum Versus Valuation Factor
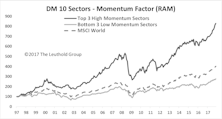
For sector overweight/underweight decisions, applying a Momentum overweight with both EM and DM countries has been most successful.
Playing The Bounce: Does The November List Bounce?

We reconstituted the November and October “Bounce” screens back to 1986 and compared their average performance versus the “non-bounce” companies. Compared with the October list, the November list shows a much weaker bounce effect.
Enjoying It While It Lasts
We don’t think the current stock market upleg is over.
Stock Market Observations
We remain bullish on stocks but with very limited visibility into 2018.
2017 Vs. Other Years Of Market Calm

Record lows in implied volatility (VIX) have been analyzed ad infinitum throughout 2017, but the readings shouldn’t come as any surprise.
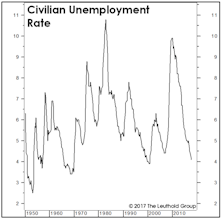
Below “Stall Speed”?
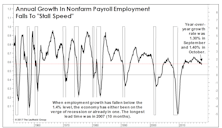
The last few months have served up some of the strongest readings observed during the U.S. economic expansion.
Revisiting The Y2K Highs
Bobby Knight thought coaching would be perfect “if it weren’t for those damned games.”
Small Cap Valuation Check
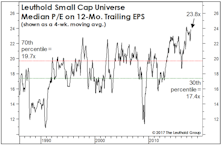
We don’t have a strong capitalization-bet recommendation, other than to remind readers that Small Caps have been especially responsive to the favorable seasonal window that began November 1st (and which extends through April 30th).
A Longer-Term Take On Sentiment
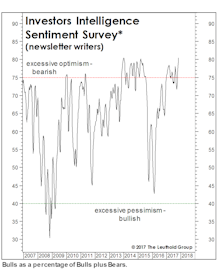
Stock market bears had a field day when the latest Investors Intelligence sentiment survey (Chart 1) saw the percentage of bullish newsletter writers spike to its “highest level since 1987.”
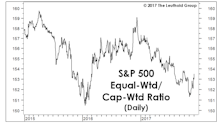
Cap Weight Or Equal Weight?
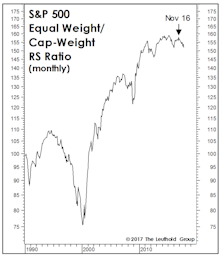
The Equal Weighted S&P 500 now trails the S&P 500 by 400 basis points YTD, and the rally is increasingly assailed as too narrow.
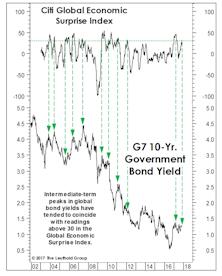
A Mysterious Bond BUY Signal…
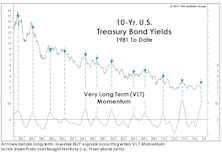
Sometimes we feel compelled to report findings that conflict with our outlook. And then there are the even rarer times we actually do it.
… Yet Another Bond BUY Signal?
The implication from VLT Momentum is that bonds are sufficiently oversold (or, equivalently, that yields are sufficiently overbought) to trigger some degree of mean reversion over the next several months.