
Inside The Stock Market ...trends, cross-currents, and outlook
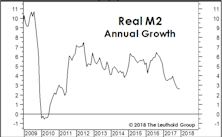
Feeble Recovery For The Feds?
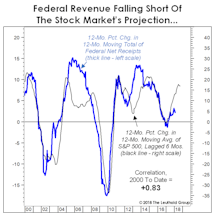
In light of the remittances they are about to drop in the mail, many readers will find it incredible that the U.S. Treasury has largely sat out the last two years of the stock market and economic upswing.
Trade War Beneficiaries?
After months of research and econometric modeling, we’ve come up with a list of U.S. and foreign industries, companies, and individuals we expect to benefit from a trade war between the U.S. and China.
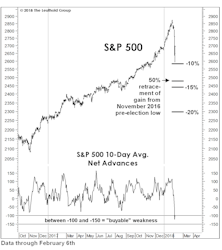
The Correction That Scared No One
The setback from the January 26th market peak represents the ninth correction of 7% or more since 2009, the most ever recorded during a single cyclical bull market.
Happy 9th Birthday To An “Off-The-Charts” Bull!
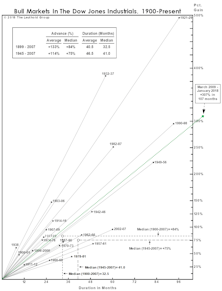
Last fall’s market rally drove the DJIA off (literally) our 1900-Present Bull Market chart. Within a year, this bull jumped two spots to #3 in the all-time rankings dating back to 1900.
Nine Corrections In Nine Years
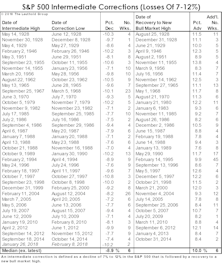
The stock market’s nine-day decline off its January 26th high met our definition of an intermediate correction—an S&P 500 loss of between 7-12%.
An ‘87 Market Parallel?
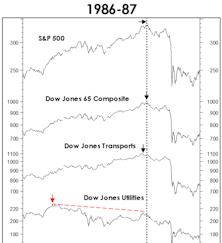
We’ve repeatedly shown how well-telegraphed the bull market highs of 1990, 2000, and 2007 were from the perspective of breadth and leadership. Surprisingly, though, the historic high of August 1987 was not so well-anticipated by the eight market bellwethers to which we’ve lately referred.
1987 Parallels (Part 2)
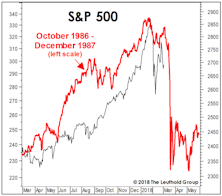
At the risk of yelling “fire” in a crowded theater, we present a few parallels between recent action and the year leading up to the October 1987 crash.
1987 Parallels (Part 3)
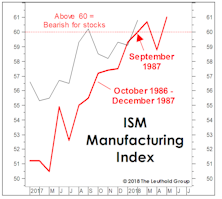
Today’s parallels to stock, bond, and forex market action of 1987 might not be so worrisome if that’s all there was to the story.
A Near-Perfect Model You Should Ignore
We somehow missed this signal in January, perhaps because we were pre-occupied with so many other signs of “climate change.”
Mid-Term Mayhem?

The prospect of a mid-term congressional shake-up may rattle the markets in 2018. Since 1962, nine major bear market lows occurred during mid-term election years, with eight of those happening during the traditionally weak months of May through October.
What’s Ailing Consumer Staples?
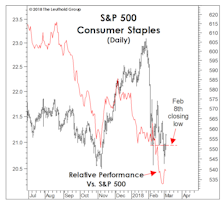
For the first time in this bull market, defensive stocks failed to provide any semblance of defense during a market correction.
Leverage Factor: A Boost For High Quality Stocks?
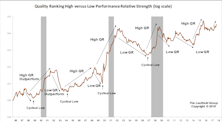
A review of Quality factors, as well as the lower valuations of High Quality stocks, supports the current High Quality cycle amid rising market volatility. The Leverage factor may provide particularly strong backing for High Quality stocks.
Most Likely Just A Correction
So, what happened to the January Barometer—the old analyst’s maxim that a market gain in January portends a gain for the full year?
Stock Market Observations
We believe the decline from the broadly-inclusive market highs of late January is a yet another late-cycle correction and not the first installment of something more sinister.
Recessions & The Stock Market
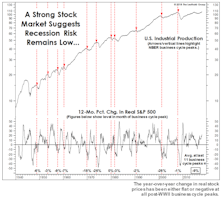
In the last couple of months, we’ve come across a handful of economic “check lists” purporting to show the relative absence of recession harbingers as the expansion closes in on its ninth anniversary this summer.
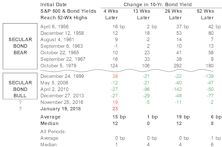
Rates: Does Trend Or Level Matter More?
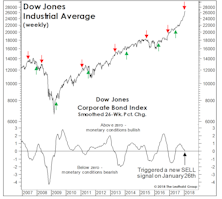
Our Dow Bond Oscillator (chart) issued what looks like an increasingly prescient SELL signal on January 26th.
Market Pressure Points?
Last month we detailed a handful of economic and monetary measures that were approaching critical thresholds from a stock market perspective.
Implications Of Extreme Momentum
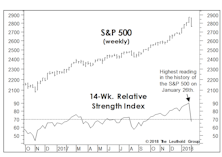
Historically, leadership and breadth accompanying an upside market move is far more predictive than the pure momentum of the move. But when intermediate-term momentum is not just strong but exceptional (as it was until just recently), there has usually been even more upside to follow.
Will Rates Kill The Low Vol Mania?
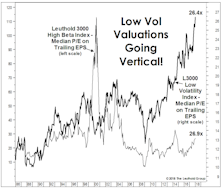
While there are many parallels between recent action and that of 1999-2000, stock market leadership is not one of them.
How About That January?!
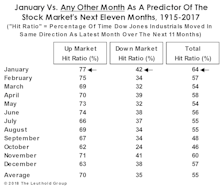
The market’s stumble in early February was so abrupt that there was no time for us market numerologists to bask in the limelight of the bullish January Barometer.