
Inside The Stock Market ...trends, cross-currents, and outlook
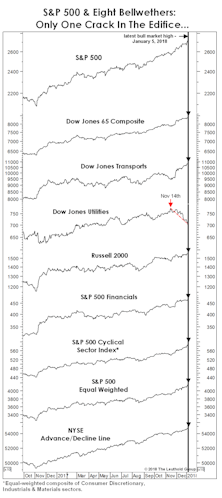
Too Many Highs, Too Many Lows??

In the past few years, we’ve shared our concerns that traditional market breadth measures may have become compromised by several developments.
What Yield “Kills” The Secular Bond Bull?
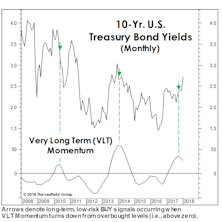
Bond market strategists remain hell bent on identifying the key yield level on 10-year Treasuries at which one can finally declare an end to the 1981-20XX secular bond bull market.
Multiple Contraction—Just A Little Patience?
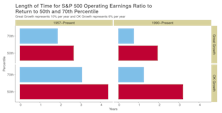
Things were bigger when you were a kid. Like that enormous sweatshirt your aunt gave you for your birthday or that hand-me-down ten-speed bike with the cross bar taller than your shoulders.
Kicking Off The Year... With A Good Year

During the first four trading days of 2018, the S&P 500 managed to match its 93-year average annual real price gain of +2.6%.
“Don’t Just Do Something, Stand There!”
Inaction has been a richly rewarded trait throughout the current bull market, and especially in 2017.
Strength Begets Strength
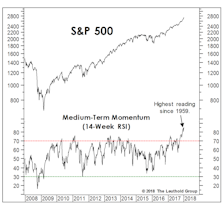
If stock market breadth and leadership look nothing like they typically do at cyclical peaks, neither does momentum.
Estimating The Upside?

The remarkable stock market breadth and momentum chronicled in these pages doesn’t come without a price.
Pressure Points?
The first few trading days of the new year have been a seamless extension of 2017—a low-volatility, “measured” market melt-up.
A Long-Term Take On Sentiment
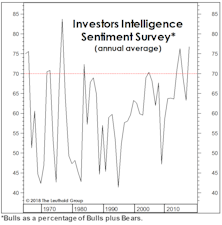
We impatiently published this study two months ago instead of properly waiting for full-year numbers.
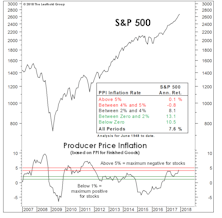
Keep An Eye On “Relative” Inflation
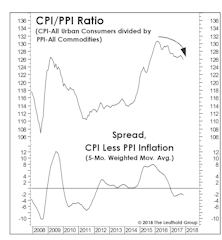
While our Group Selection (GS) framework hasn’t yet warmed up to commodity-oriented industries, our macro work suggests perhaps it should.
Asset Allocation: Buy Strength Or Weakness?
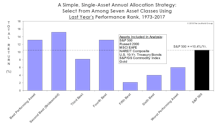
We are contrarians at heart, but learned quickly that successful contrarian investing is far more complicated than simply buying assets that are down the most in price.
Bridesmaid Strategy: Track Record

Last year’s Bridesmaid gain of +21.8% matched the benchmark (obviously, since it was entirely invested in the benchmark).
Bridesmaid Strategy: Risk & Return
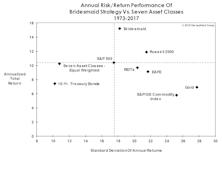
The concept of risk is hardly at the forefront of the investor psyche after the second-least volatile year in stock market history.
Bridesmaid Strategy: Picking The Year’s Best Asset
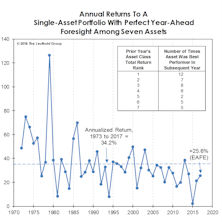
Here’s another way to look at the persistence of momentum across asset classes for the last 45 years.
Bridesmaid Strategy: For Equity Managers

Our analysis of the Bridesmaid effect originated more than a decade ago, with an initial focus on equity sectors rather than asset classes.
Bridesmaid Strategy: Sector Track Record
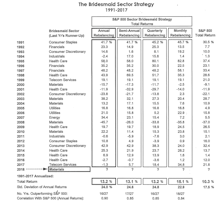
Table 3 shows annual performance results for the Bridesmaid sector strategy under all four rebalancing frequencies, along with the sector selection for the annual version of the strategy.
Bridesmaid Strategy: A Value Alternative

For those not psychologically suited to a momentum approach, we’ve developed a contrarian sector allocation strategy that’s delivered even better long-term performance than the Bridesmaid approach.
Bridesmaid Strategy: Low P/E Sector: Annual Results
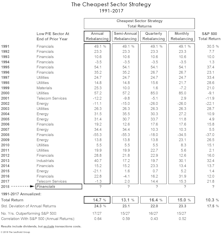
Table 5 shows annual performance results for the Cheapest Sector strategy under all four rebalancing frequencies, along with the lowest P/E sector for the annual version of the strategy.
Industry Group Dreams And Nightmares

For nearly three decades The Leuthold Group has tracked hypothetical portfolios composed of the previous year’s industry group “Dreams” and “Nightmares.”
Economic Performance: Powerful Factor For Country Rotation
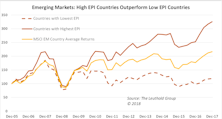
In previous studies, we looked at two classic factors for employing a country rotation strategy: valuation and momentum.