
Inside The Stock Market ...trends, cross-currents, and outlook
“Unlevered” Treasuries Aren’t A Bubble
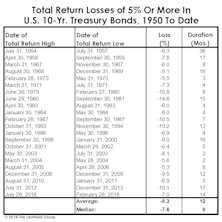
It’s been popular to argue that U.S. government bonds are a bubble while U.S. equities are not. But even if we agreed, the potential cyclical total return losses in Treasury bonds are a fraction of those likely to occur in an equity bear market.
Company Leverage And The Impact Of Rising Interest Rates

Higher corporate leverage and rising short-term interest rates have not yet led to problems in the credit markets, but investors should be mindful of potential risks.
The Bulls And Bears Agree!
Yes, bulls and bears now hold their respective positions for the same reason—i.e., the U.S. economy is exceptionally strong. The stock market is accommodating this rare bipartisanship with sufficient reason to support either position.
Multiple Personality Disorder?

Market behavior is always nebulous enough to generate diverging opinions, but lately it’s been sufficiently strange to give rise to a diverging set of facts.
Where’s The Spring In The Step?
Old age alone may not kill the bull, but it can make it more susceptible to an array of life-threatening maladies.
Trouble Is “Spreading”
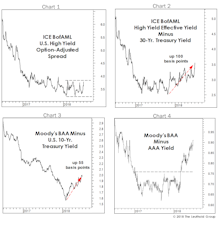
Junk bond option-adjusted spreads (OAS) have remained relatively tight throughout the stock market pullback and recovery (Chart 1), assuring some bulls that the action is nothing more sinister than a “healthy and overdue” correction.
Inflation Warning Flags?
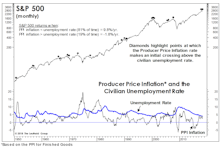
After yet another benign figure on wages for June, the idea that inflationary pressures might be a problem for the stock market seems far-fetched.
A New ISM “Composite”
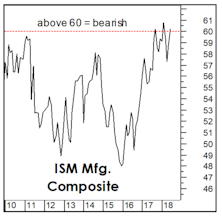
Over the past year, we’ve highlighted three mechanical market models based solely on components of the ISM monthly manufacturing report (Charts 1-3).
An Old Chart Whose Time Has Come?
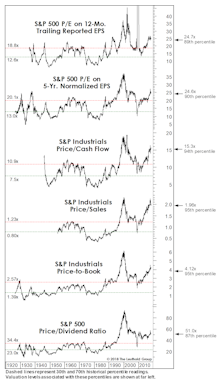
No, it’s not a 1990s-like love affair with the stock market. But it’s surely a sign of the times when TV pundits seem to have dropped even passing references to valuation when spinning their mostly bullish market yarns.
Foreign Stocks “De-Coupling”

Market action has been broader and better than we expected given monetary conditions, and Small Cap strength seems to lend credence to contention that rates aren’t yet high enough to bite.
Apple Back Tickling 4%
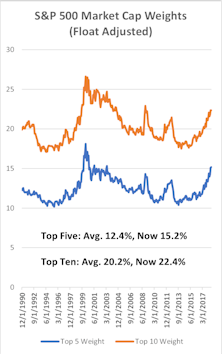
Apple has added 10% to its market value since the end of January, and this action has pole-vaulted the Cupertino firm back into the rarefied air of the “4% Club” (S&P 500 weighting) for the fourth time in six years.
Trade-War Thematic Group

Trade wars or trade tensions, quietly started in 2017, hadn’t captured the market’s attention until early March this year—as demonstrated through a review of internet keyword search data of “Trade War” and “Tariff.” We present our Trade War thematic group which captures U.S. companies that could suffer the most from a trade war between the Trump administration and the rest of the world.
What A Difference A Year Makes
Early this year we chatted with the retired founder of a Midwest investment management and research firm. After living and breathing markets for six decades, this bearded and iconoclastic character had avoided financial publications, Bloomberg, CNBC, and the like for more than a year.
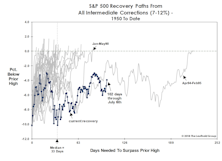
Is The Bull Just Napping?
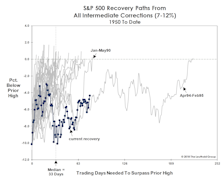
Old age has certainly put no limitations on the bull’s exploits, so we should be cautious in reading too much into its meandering recovery path. However, it’s possible that action since the February low is not a recovery process but rather a countertrend bounce within a larger downtrend.
Is Market Breadth Misleading?

The stock market has narrowed, but not in the way we envisioned—nor in a way that’s consistent with most historical bull market tops. Small Caps and market breadth measures are traditionally the first to wilt when monetary tightening begins to hit the stock market. Instead, they are the leaders.
What The Curve Does And Doesn’t Tell Us
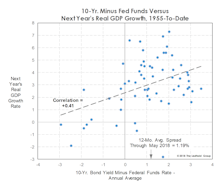
The gap between the 10-year Treasury yield and the federal funds rate has narrowed sharply in the last year but remains a long way (~110 basis points) from inverting.
A Smart-Money Split
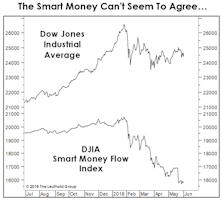
The Supply/Demand category carries the smallest weighting among the five factor groupings in the Major Trend Index, and this weighting is further diminished by the fact that its components rarely line up in a way which loudly proclaims that an “accumulation” or a “distribution” phase is underway. Today is just another of those typically inconclusive times.
Analysts, Summon Your Inner-Angler!
Quantitative investment firms are increasingly touting the cross-disciplinary backgrounds of their research staffs, with prior high-level experience in areas such as medical research and engineering not uncommon.
Shun ETFs With Largest Inflows

We found that ETFs with the largest one-month, two-month, and three-month fund inflows underperformed going forward. When further broken down by sub-asset class strategies, this pattern is pronounced among equity ETFs, while fixed income ETFs do not appear to be affected by fund flows.