
Inside The Stock Market ...trends, cross-currents, and outlook
The Market Told You So
First quarter profits have been terrific, and this quarter’s will be too. Enjoy them, but remember that the market “paid” you for them many months ago. Don’t submit another invoice…
The “Correction” Clock Is Ticking
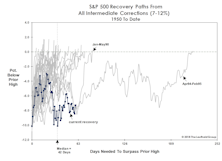
2018’s S&P 500 setback qualifies as an “intermediate” correction. Historically, the duration of intermediate corrections is brief, and recovery time to move back above prior highs has also been brief. This year’s retracement route is already among the most meandering of all recovery paths since 1950.
Cashing In On The LEI?
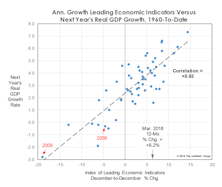
The consensus view is that the stock market will be fine as long as there’s no recession in sight.The same LEI that has displayed a fine GDP forecasting record has shown essentially no relationship with S&P 500 forward twelve-month performance. In fact the regression line shows a slight negative slope!
A “Busted” Bond BUY Signal
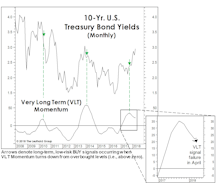
Last October our VLT algorithm recorded a bond BUY signal—one that we said, at the time, conflicted with our outlook.
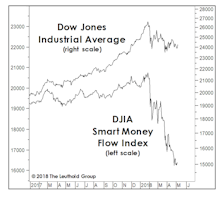
Earnings Soar While Liquidity Circles The Drain
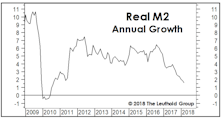
Question: How can you be cautious on the stock market with recent earnings results so spectacular?
The Gap Is Back!
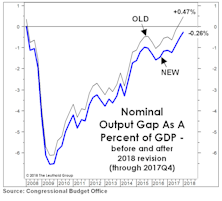
We celebrated the official closure of the GDP Output Gap in December, but that milestone was revised away in April by the statisticians at the CBO through a downward adjustment to the estimated rate of “full employment.”
A New Hurdle For An Old Bull?

The first quarter S&P 500 earnings “beat” rate stands to be the highest in history, as any CEO with a pulse has learned to lower the hurdle.
Staples Still Stomped Upon

Consumer Staples has historically been the sector most resistant to intermediate stock market corrections, exhibiting an average “downside capture” of less than 40% during all such declines dating back to 1989.
Cycle Collision?

The coming months form a bearish cross-section of two of the most prominent calendar anomalies: “Sell In May,” and the Presidential Election Cycle (in which the mid-term year is statistically the weakest). Between the two, we’d have to rate the former as more powerful and statistically persistent.
EM Country Rotation Based On A Stock Factor Model

Back testing shows stock-level factor alpha can be captured at the country level. With the rapid growth of single-country ETFs, this may prove an efficient, practical alternative to individual stock selection.
This Is A Head-Scratcher
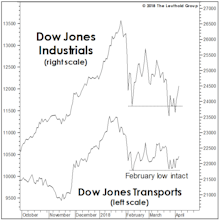
The longest and probably most complex bull market in history is not going to make a clean and decisive exit.
“What, Me Worry?”
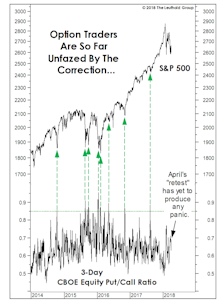
Our shortest-term put/call measure has yet to reflect the level of fear usually triggered by a correction of this size. Meanwhile, the market setback has done almost nothing to stymy the optimism of either market newsletter writers or mutual fund timers.
A “Drug-Free” Market Decline?
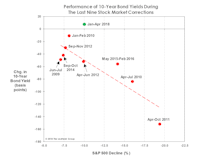
Yields on 10-year Treasuries are up 10 bps since stocks peaked in January, a clear break from the behavior of prior corrections. The last four stock declines of 10%+ were self-medicating—having been accompanied by bond yield declines of 50 to 150 basis points.
Assessing The Selling
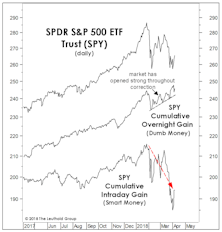
While the January 26th bull market high illustrated none of the hallmarks of a major cyclical top, there are secondary signs that a stealthy distribution process may be underway, such as an overwhelming bias toward opening market strength followed by intraday weakness.
Minding The Middle

As equity investors, we’ll readily admit to an excessive focus on the Federal Funds rate and the 10-year U.S. Treasury yield.
A Fleeting Glimpse Of Goldilocks?
The first several years of this recovery badly underperformed forecasts, with partial blame going to a pair of deflationary shocks (the European debt crisis and oil price collapse).
The Foreign Stock Conundrum

A good rule of thumb for thematic and sector investors is that stock market leadership rarely repeats itself in consecutive cycles.
Musings On Margins
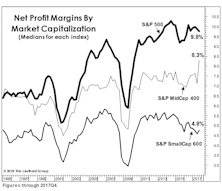
Fourth quarter earnings were the last ones to be burdened by a 35% top marginal corporate income tax rate, and therefore seem to have been given a pass by the analyst community.
The Commodity Stock Disconnect
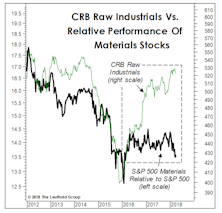
We’ve chronicled the ever-expanding gap between commodity prices and commodity-oriented equities. Don’t expect a rebound in one based on the strength of the other. There’s no clear historical tendency for the weaker asset to catch up.
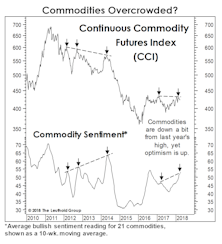
A Troublesome Commodity Pattern...
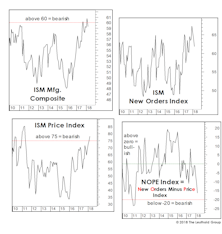
During each of the last five months, the U.S. economy has shown a broadening array of “late-cycle” characteristics.