
Inside The Stock Market ...trends, cross-currents, and outlook
Energy Still Out Of Sync
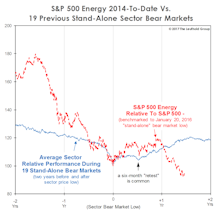
We wrote a year ago that the Energy sector’s 2014-2016 decline of 47.3% was the worst-ever sector decline occurring outside of a cyclical bear market.
Bonds And Aristocrats

The last year has been a difficult one for any person or theme tied to the “establishment”—including mainstream Republicans, mainstream Democrats, EU commissioners and lobbyists, and, yes, even one of the established leaders of the cyclical bull market—the S&P 500 Dividend Aristocrats.
Recent Years’ Oil Price Experience Akin To 1980s’
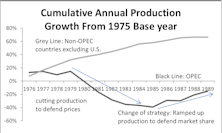
We revisit commentary we published in 2015 regarding the late-2014 oil price crash and review why, at that time, we believed oil prices could stay at depressed levels for a longer period than most expected. Additionally, we advise avoiding two Energy sector segments: companies with high balance-sheet risk, and Energy Royalty Trusts.
Areas To Avoid In The Energy Sector
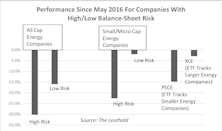
Anticipating prolonged weakness of energy prices, we advise avoiding two segments within the Energy sector: companies with high balance-sheet risk, and special Energy investment vehicles called Energy Royalty Trusts.
A “Measured” Melt-Up
The stock market “melt up” scenario is underway but has proven less broad than we expected. Just as in the late-1990s, Technology and NASDAQ are the main subjects of investor adulation.
Stock Market Observations
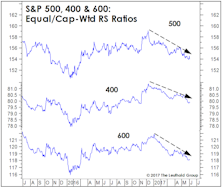
After a two-month lull, stock market momentum reasserted itself in May bringing our summer S&P 500 target of 2,600 back into focus… Meanwhile, we’ve fielded several media calls about the “FANG” stocks’ large contribution to some YTD returns—but that doesn’t diminish the new highs being made elsewhere by disparate groups… NYSE Weekly A/D Line and New Highs/Lows figures also suggest the stock market isn’t yet top-heavy enough to tip over.
Stocks Versus Bonds: A Lonnngggg-Term View
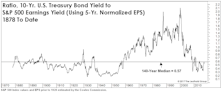
On a 50-year view, stocks do indeed look cheap relative to bonds. But the inclusion of 90 earlier years of data muddies the message.
Need More Reasons To Buy?
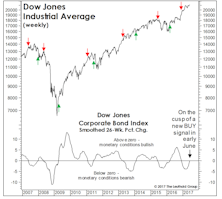
When it rains, it pours. As if the market’s broad new highs of early June aren’t enough, here’s a pair of sub-models from the MTI’s Economic category that are set to turn bullish.
Inflation Complacency?
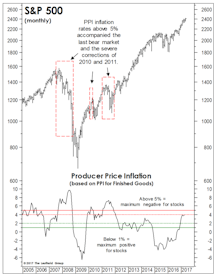
Leading inflation indicators have leveled off so far in 2017 after last year’s huge rebound from the deeply oversold readings produced by the 2014-2015 collapse in commodities.
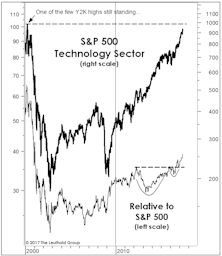
Technology: What A Long, Strange Trip It’s Been
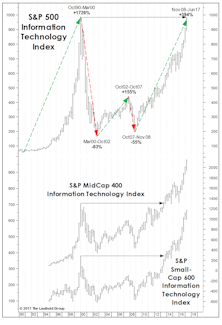
Last month we suggested that proclamations of a new Technology stock bubble were spectacularly premature. And, following another month of healthy gains, the S&P 500 Information Technology Index still sits on a perch that, fundamentally speaking, looks nothing like that of March 2000.
A Contrarian “Late-Cycle” Play?

The Amazon Effect masks both the underperformance of the average Discretionary stock and the relative value that’s been reestablished across the sector. “Discretionary ex-Amazon” is a better contrarian pick than Energy.
Energy: Too Early To Bottom Fish
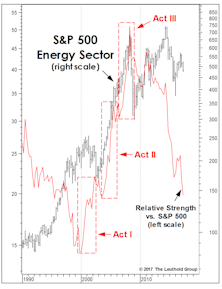
The gap between crude oil prices and Energy sector RS is now much wider than seen even at that historic 2014 juncture. The “divergent” weakness in Energy stocks suggests that crude will likely trade lower.
Emerging Markets: Fundamental Diffusion Indicators

Within EM, more robust growth is being exhibited by: 1) firms in Emerging Europe; 2) companies in Energy, Materials, and Financials; and, 3) larger cap companies.
MSCI EM Reclassification: Achiever & Aspirers
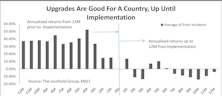
EM segments on the “Aspirer” watch list for MSCI annual market reclassification: China A-shares and Argentina. The “Achiever,” Pakistan, just recently started trading as a new member of MSCI EM Index.
Spring Doldrums?
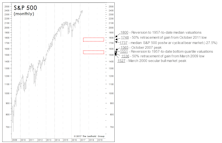
Bull markets bail out bad decisions—like buying the market high ahead of the Great Recession.
Stock Market Observations

The S&P 500 has labored beneath its March 1st bull market high for the last two months while underlying breadth and leadership trends have remained mostly favorable.
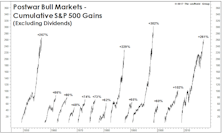
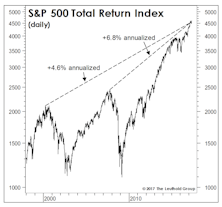
How To (Almost) Double Your Money In Under Ten Years
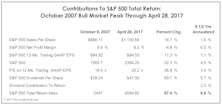
Buying the S&P 500 on one of the worst possible days in history ultimately yielded a total return of +87.4% (+6.8% annualized) through the end of April 2017...darn, sounds like an advert for Vanguard!
Estimating The Downside
We remain cyclically bullish on equities, but nonetheless like to engage in occasional downside “target practice” to shape our expectations for the next bear market.
Technology: Popping The “Bubble” Talk
The S&P 500 eclipsed the “Twin Peaks” (2000 and 2007 highs) in 2013, and two years later the NASDAQ topped its 2000 high.
Still In Thrall With Low Vol

Ongoing investor obsession with stability strikes us as considerably more dangerous than the situation in the Tech sector. While many see market parallels with 1999, we instead see a mirror image.