
Inside The Stock Market ...trends, cross-currents, and outlook
The Great Two-Way Market

Cribbing from Charles Dickens, February was the best of times and the worst of times.
Insider Block Measures...Selling Remains Heavy, But Still Below Historical Extremes

The latest 10 week reading has risen to within 5% of historical selling extremes.
Inflation & Interest Rates
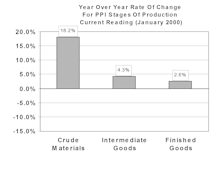
Favorite stock groups now “inflation and interest rate proof”?
Volatility Update…New Year Brings High Volatility

Year to date, S&P volatility has reached nearly 48%.
Performance By Cap Tiers...Our New Measures
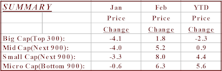
S&P 500, S&P 400, and Russell 2000 may not always present accurate readings of Big cap, Mid cap and Small cap performance, respectively.
Tracking Shifts In Market Capitalization Leadership
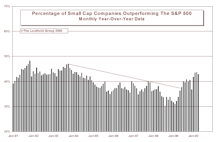
Small caps and Mid caps now outperforming Big caps. A change in leadership appears to be in progress.
February Mutual Fund Flows

U.S. focus equity fund inflows are estimated at a record-level $31 billion in February. Also, a look at how foreign investment has played an instrumental role in providing bullish support to the U.S. stock market.
View From The North Country

Workers’ stock market purchasing power at all time low. Also, a book out of the past, has an eerie ring to it.
Cash Acquisitions
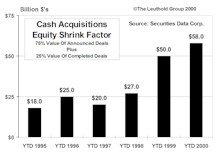
YTD cash acquisitions of $32.3 billion reduces YTD offerings of $49 billion to produce net equity supply of $16.7 billion for the year.
Who's Afraid of the Fed?

The public certainly is not afraid of Mr Greenspan…..Strong public confidence now a key stock market support factor.
Playing The Bounce Update

We elected not to “Play The Bounce” this year. With the overall market soaring to new highs during December, the stage didn’t seem to be right for superior performance from the “Playing The Bounce” stocks.
Small Cap Divergence...Growth Versus Value

The divergence between Small Cap Growth and Value performance continues to widen. It has been all Growth since August 1998.
January Mutual Fund Flows

This was the best January on record in terms of net inflows, topping January 1997’s $23 billion.
Cash Acquisitions
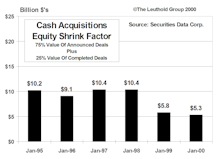
January cash acquisition activity was relatively quiet, at its lowest level in six years.
View From The North Country

View is just for the fun of it this month: Fearless Forecasts 2000.
Insider Block Measures...Selling Remains Heavy, But Still Below Historical Extremes

The latest 10 week reading is in a fast uptrend, but still below historical selling extremes.
New Improved Performance Measures For Capitalization Tiers
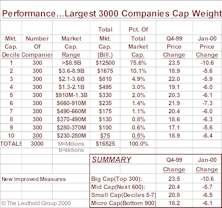
Today’s popular stock indices may be overweighted toward tech.
Volatility Update…New Year Brings High Volatility

NASDAQ Index volatility has skyrocketed to nose-bleed levels since 1993.
Tracking Shifts In Market Capitalization Leadership

Could be the beginning of Mid Cap and Small Cap out performance.
Volatility Update…Year End Summary

While the 1930s were more severely volatile for the S&P, 1999 ranks second only to the 1974 record (45.1%) in the post WWII era.