
Inside The Stock Market ...trends, cross-currents, and outlook
View From The North Country

“What? You’re buying MORE Junk Bonds?!” “Regulation FD” could ultimately improve the depth and quality of analyst research, turning the focus back to more relevant, longer term outlooks. “Sell Side” Stock Research: The reasons why we no longer use it.
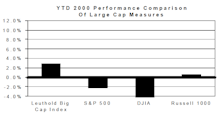
Capitalization Tier Meausres

Continuing to evaluate Leuthold Index methodology.
When the Bears Have Thanksgiving, Will the Bulls Have Christmas?

November market devastation not the result of Florida Follies….Tech sector disappointments and lowered prospects are most of it. The Good News: Two-thirds of the current bear market may now be history. Expect counter trend rally soon, but third and final “Bear” leg likely in Q1, 2001.
Super Bowl Internet Advertisers...Where Are They Now?

On average, the public companies that advertised had an average loss of 72.4% through November (calculated from 1/28/00).
Undervalued & Unloved Investing

Even with dry spells, the long term performance record of this screen has been excellent, outperforming the S&P 500 by 1195% since 1975.
View From The North Country

“What? You’re buying Junk Bonds?!” Although some may view this as a high-risk, contrarian bet, the logic behind the strategy is explained.
Insider Block Measures...Heavy Selling Resumes

The latest 10-week reading has risen back above historical selling extremes after spending several weeks within the high end of the “normal” selling range.
Wall Street Meets Pennsylvania Avenue

Stock market returns for U.S. Presidents while in office. (Whig Party Presidents produced best average returns!)
Capitalization Tier Meausres
Currently evaluating Leuthold Index methodology.
Will November Be "A Month of Cold Chilling Rains"?

I think November might be a rather dreary month for the U.S. stock market, even if we don’t get those cold chilling rains.
Technology: What’s The Downside?

Not even the mighty techs are immune to saturation, overcapacity, cyclicality, and fierce competition.
Volatility Update

S&P volatility accelerates in October while NASDAQ volatility continues at unbelievable levels.
October Mutual Fund Flows: Amazing How Main Street Keeps Buying

Supply/Demand wildly bullish—wo why isn’t the market going up? A look beyond the supply/demand dynamics factors.
Volatility Update

S&P volatility moderating while NASDAQ volatility bounced back to very high levels.
Capitalization Tier Meausres
Currently evaluating the Leuthold Index methodology.
Insider Block Measures...Recent Heavy Selling Sends A Cautionary Signal

The latest 10-week reading has risen back above historical selling extremes.
View From The North Country

Leuthold’s current point of view and outlook regarding the Economy, Interest Rates, Inflation, and Earnings.
Is October "The Cruelest Month"?

October carries a reputation with investors as the “cruelest month”, but statistically, September is most likely to be a downer. Paid To Play Portfolio: Now up an unbelievable 57% YTD. Tech Sunset? Professionals seem to be lightening their load in technology and communication commitments, now targeting a market weight.
September Mutual Fund Flows: Main Street Investors Staying The Course

· It really is incredible that equity fund inflows have held up so well this year. Also, Supply Factors: Heavy cash acquisition activity is bullish for stocks, since it reduces the overall equity supply available to investors.
August Mutual Fund Flows: Main Street Investors Staying The Course

The YTD $194 billion net inflow through the end of August is now 67% more than 1999’s $116 billion net inflow over the same YTD period, and has already matched the annual record (1997’s $194 billion). Supply/Demand: Offerings volume was very heavy during the first half of August, but began to dry up in the second half of the month.