
Inside The Stock Market ...trends, cross-currents, and outlook
Dreams & Nightmares: Mid Year Update

Mid-year update how an investor would have done if they had been fortunate enough to invest in the 20 best performing industry groups (and visa versa).
June Mutual Fund Flows

U.S. focus equity fund net inflow of $14 billion is estimated for June. The bear market which began roughly 15 months ago has caused investors to become much more cautious toward equities this year, as evidenced by the depressed YTD net inflow levels going into U.S. focus equity funds.
View From The North Country
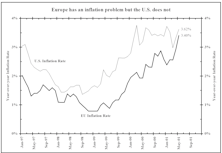
The European view of the world, by guest “View” editor, Jim Bianco.
Volatility Update...Significant Slowdown In June

In June, the NASDAQ and S&P 500 volatility tapered off considerably.
"The Pause That Refreshes...."

Leadership Expectations: Small and Mid Caps (not Large Caps); Energy Rebound; Biotech and Broad Health Care; some Technology subsets. How long for the NASDAQ to recover to previous highs? Assuming an 11% annual growth rate, the “NAZ” will not recoup until September 2009.
Insider Block Measures...Brief Selling Respite In Early June, But Then Heavy Selling Resumes

Early in June, it appeared that big block selling was on the decline. But in recent weeks it appears that heavy selling has resumed once again.
What About the Recession and the Awful Earnings?

The NBER (U.S. “recession judge”) often fails to label recessions until after they are over. Sector Earnings in 2001: Estimate operating earnings for the cap weighted measures will be down 15%, maybe 20%. Expect the economy will start to stabilize by year-end, and improve in early 2002.
Capitalization Tier Meausres

Continuing to evaluate Leuthold Index methodology.
"Value" Performance Superiority May Diminish Or Even End Soon
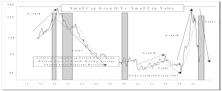
Our work indicates Small and Mid Cap growth stock action is heating up. It is entirely possible that a transition to Small and Mid Cap growth leadership is already in the works.
View From The North Country

Managing Your Mother Lode…Your Serious Money. Ten rules written for a soon to be published book, The Book Of Investing Rules, which contains an anthology of rules from well-known investors and financial professionals.
Capitalization Tier Meausres

Continuing to evaluate Leuthold Index methodology.
Summer Market Hot?…..Or Not?

Statistically the summer rally is mostly fiction, historically producing average or slightly below average stock market performance….but don’t plan a three month vacation yet!
"Value" Performance Superiority May Soon End

Value may continue to outperform Growth for the balance of the year, but by a narrower margin.
Stock Market Supply/Demand

U.S. focus equity fund net inflow of $15 billion is estimated for May, which is somewhat less than the $17.5 billion net inflow in April, but somewhat more than $13.2 billion net inflow last May.
Volatility Update...Some Signs Of Slowing

Remains high, but there are some signs of slowing.
Insider Block Measures...Insiders Didn’t Buy This Dip

The latest 10-week reading fell 16% from the previous week, but the average remains above historical selling extremes.
April Mutual Fund Flows: Net Inflow Returns In April

U.S. focus equity fund net inflow of $15 billion is estimated for April. This reverses the record level $15.7 billion monthly outflow in March.
Insider Block Measures...Insiders Not Buying This Dip

Despite stock price corrections in the last year, significant net selling continues among the “smart money”.
View From The North Country

I am positive about today’s stock market, but there are some considerations that could cause my optimism to be premature. A bubble/bust comparison between the great gold and silver bubble of 1979-1980 versus the 1998-present Internet sector. Not all single digit stocks should be shunned.
Capitalization Tier Meausres

Continuing to evaluate Leuthold Index methodology.