
Inside The Stock Market ...trends, cross-currents, and outlook
Weathering The Strapped Consumer – Introducing New “Strapped Consumer” Theme

While we currently favor little to no allocation to Consumer stocks, we realize that many clients must maintain a substantial weight in the Consumer Discretionary sector. For those clients, we are proposing a new thematic stock market group this month: The Strapped Consumer.
Q3 Market Action

Perhaps if you were living in some obscure quarter of the Amazon jungle for the last month, you may not have heard the news that the Dow Jones Industrials Average was approaching and finally achieved a new all-time high in late-September and early October.
Mutual Fund Flow…..Five Consecutive Months Of Outflow From U.S. Equity Funds

For the traditional equity funds, this was the fifth straight month of net redemptions.
Today's Economic Recovery In Perspective
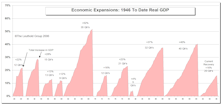
On a long term basis, we continue to be concerned about the sustainability of the current economic expansion, and we expect a significant slowdown by mid 2007.
Price Divergence Between Metals Equities & Physical Metals – A Buying Opportunity?
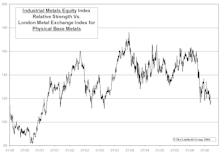
Investors have soured on Industrial Metals equities, likely based on the belief that the prices of the underlying physical metals have stopped going up.
Is Performance Rotation Here To Stay?

Group rotation has made it tough for managers to outperform. There has been a lack of sustainable leadership.
Is Private Equity Driving Record Level Cash Acquisitions?
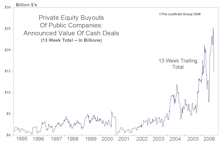
Some clients have been asking if private equity firms are responsible for this record level activity. The truthful answer is, well....yes and no.
View From The North Country

Despite the stronger stock market, there continues to be a healthy degree of bearish sentiment prevalent in today’s market.
Attractive Groups Based On Insider Scores

We have been taking the opportunity each month to highlight a portion of our groups’ insider buying and selling scores. This month, we are presenting the groups with the best insider scores.
Mutual Fund Flow…..Fourth Consecutive Month Of Outflow From U.S. Equity Funds

While the figures do not suggest much growth in demand for domestic equity funds since last year, they do indicate that ETFs are gaining market share.
View From The North Country

Even before Major Trend Index improved to Neutral, Leuthold was getting more bullish. Also, Is the Sun Rising or is it Setting on Japan?
August Market Action

S&P 500 is now within striking distance of hitting new cyclical highs.
Transportation Stocks As Economic Warning Signal
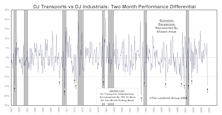
Six of eight recessions since 1957 saw signals registered by the Transportation Divergence monitor. Recent divergence may be warning of an impending economic contraction.
Breadth Is Lagging…..But It Can Lag For a Long Time Before The Market Rolls Over
Market breadth improving, but still relatively weak. Narrowing breadth can, however, persist for a long time. There was a two year period of diverging breadth in 1998 to 1999, prior to the last bear market.
Unattractive Groups Based On Group Insider Scores
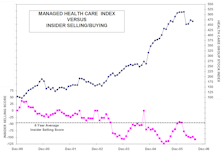
In prior issues, we have presented those equity groups that had been displaying the best readings in terms of insider selling/buying. Several clients have expressed an interest in seeing those groups with the most significant levels of insider selling. The following table presents the ten groups with the most pervasive insider selling.
Stock Market Downside Limited Based On Current Valuations

Small Caps significant laggards in July, and technicals which had been supporting Small Caps, despite excessive valuations, have now eroded. Small Cap leadership model now negative.
Mutual Fund Flow…..Public Continues To Be Cautious Toward U.S. Equities

Both domestic and foreign market equity funds have seen a big fall-off of interest in the wake of recent market declines.
Market Action After Last Fed Rate Increase

Study of stock market performance following last Fed interest rate hikes indicates no correlation to future stock performance. Investors expecting a big surge based on this being the last hike may be disappointed.
The Homebuilding Group – Value Play Or Value Trap?
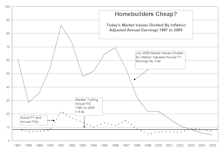
Everybody sure hates the Homebuilders. However, contrarians should take note of this month’s analysis of earnings prospects, insider selling/buying, and the outlook for future housing starts. Now is not the time to be bottom fishing here.
View From The North Country

Everybody sure hates the Homebuilders. However, contrarians should take note of this month’s analysis of earnings prospects, insider selling/buying, and the outlook for future housing starts. Now is not the time to be bottom fishing here. Nor is it time to be buying oil stocks.