
Chart Of The Week
Is The Yield Curve Overrated?

The U.S. yield curve has flattened in the last few months but remains a long way from inversion—an event that’s preceded each of the last eleven recessions.
Don’t Call It A Bubble
Thanks to reasonable valuations outside the United States, our work finds global equities only moderately above their long-term valuation norms.
The Bull Will Benefit The Federal Fisc

Federal receipts tend to be a reflection of where the economy and stock market have been rather than where they might be headed.
Much Ado About Not Very Much

In February, NYSE Margin Debt finally edged above its prior record established in April 2015, a certain sign—according to many bears—that stock market speculation has reached a fever pitch.
What If You Bought "The" Top?

Given the flood of assets into passive equity mutual funds, it’s a mathematical certainty that some unlucky investor will make his or her first purchase of the SPDR S&P 500 Trust on the exact day of the eventual bull market high.
Long-Lagging Utilities Catch Up
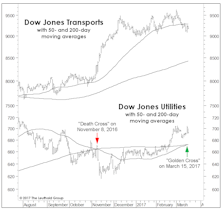
For months on end, the Dow Jones Utilities has been the only bellwether group not to participate in the parade of new bull market highs.
Using Energy Stocks To Forecast Oil
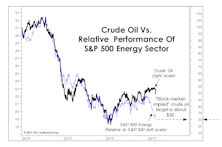
The latest Green Book highlighted the unusual divergence between crude oil and the relative performance of the S&P 500 Energy sector. Crude prices had—until this week—been trading near 18-month highs, while the relative strength of Energy stocks had slipped back towards January 2016 lows.
The Financial Sector: "Running To Stand Still"

The Financial sector is up more than 30% from last summer’s Brexit lows and, as of March, ranks atop our Group Selection (GS) Scoring framework for the fourth consecutive month.
Bull Market Continuation Signal?

The stock market looks overbought on virtually every technical measure we can think of, but an overbought condition doesn’t always mean the market is vulnerable. To the contrary, we’ve found that “initial” overbought readings—like the one triggered last week on the S&P 500’s 14-Week Relative Strength Index—are generally followed by above-average gains in the intermediate-term (Chart).
Another Take On High Valuations

While stock market valuations are high, they are still considerably below their Technology bubble peak of March 2000. We’ve therefore conceded that there’s still room for a true market melt-up as long as cyclical conditions remain positive.
Signs Of Improving Earnings & Sales

Growth Is Re-emerging: A recurring theme in recent Leuthold Group research is the apparent turn in corporate profits and a general improvement in business results. To monitor corporate sales/earnings trends, we measure the number of companies reporting higher quarterly sales and earnings than a year ago, versus companies reporting lower sales and earnings.
Apologizing in Advance for Trump

While Wall Street is extremely well represented in the new administration, we doubt that Wall Street’s performance under Trump will come close to that enjoyed under Obama.
Global Configuration Of Bond Yields Supports Continued Bullish Dollar Stance

Contrary opinion theory is a valuable tool to investors, but today there are so many self-described contrarians that we sometimes struggle to identify what’s “consensus” and what’s “contrary.”
Why The Treasury Department Should Watch The Tape

In recent years the Fed has been more forthright than ever about the importance of the wealth effect as a transmission mechanism of monetary policy. But this (or any) policy effect hardly exists in a vacuum, and the Fed would do well to recognize that stock market swings have played an increasingly important role in the country’s fiscal balance.
Active Vs. Passive Return Drivers
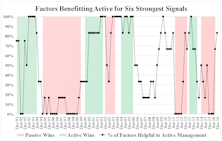
Our July special report “Active vs. Passive: A Three-Club Headwind” studied the recent dominance of passive indexes over actively managed funds.
The Year That Could Have Been

It’s well-known that 2016 was a very difficult year for active equity managers, as if purveyors of passive products were in need of a lifeline. That’s especially disconcerting because the year was one that offered—if nothing else—big potential for outperformance.
Today's Bull Versus The 1990s

The advance since March 2009 has just surpassed the bull market of 1990-1998 to become the second longest bull of all time, and it will move into the top spot if it can survive until next March 15th (the “Ides of March”). The current record holder is the 1921-1929 bull, which expired just a few days following its eighth birthday.
Dividend Aristocrats Look Vulnerable

The mania for stability and dividend yield have been two of this bull market’s defining characteristics.
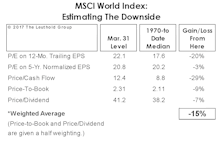
Broad Market Valuation Check

It was less than two months ago that broad market valuations--measured by the Leuthold 3000 median Normalized P/E--were still within the wide range we consider to represent fair value (between the 30th and 70th percentiles). Thanks to the rush of post-election euphoria, that's no longer the case, with median P/E shooting up three points in six weeks to 26.1x.
DJ Transports Move To New High

Wednesday's action erased two divergences cited in the latest Green Book, with both the NYSE Advance/Decline Line and the Dow Jones Transports moving to new bull market highs. The latter index had failed to do so for almost two years.