
Chart Of The Week
Correlation "Cape"-r

During a stock market rally we find difficult to comprehend, it somehow seems appropriate to publish a chart we’re almost at a loss to explain. The first chart shows the 90-year history of the trailing one-year (252-day) correlation of daily returns across market sectors. Correlations have been in a free-fall of late, and now appear to have a good shot at undercutting the all-time low established midway through the 2000-2002 bear market.
A Tale Of "The Tail That Wags The Dog"

We believe the continued strength of this seemingly ageless bull market is due in part to the weakening U.S. dollar, which impacts the real economy and financial asset returns alike.
A Statistical Take On The Fourth Quarter

We just completed a simple study for those market bulls who might find themselves temporarily lacking in confidence (assuming such an animal isn’t extinct by now).
Stock Market Valuation Check

The Major Trend Index has bounced back into positive territory, and we expect an already-expensive U.S. market to make even higher highs later this year and into early 2018. But we are keeping an eye on the Intrinsic Value work to assess the potential losses that might occur when cyclical conditions eventually turn hostile—possibly in later 2018 or in 2019.
Don't "Wage" On A Bond Rally

This morning’s weaker-than-expected reading on wage inflation will no doubt boost applications to the “lower for longer” school of thought on interest rates…
What's Ailing The REITs?

This year’s cooperative bond market hasn’t helped rekindle much enthusiasm for bond-like stocks like the REITs and the Dividend Aristocrats, which are up 3% and 6% YTD, respectively, compared with a 9% gain in the S&P 500.
Turning Another Page On The Earnings Calendar

The end of August means the second quarter earnings season is almost in the books.
Small Caps Surrender Their "Trump Bump"...Now What?
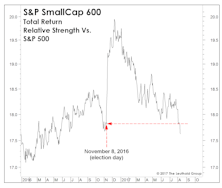
With this week’s losses, Small Caps have relinquished all of the massive outperformance they enjoyed in the month following the presidential election.
Foreign Equity Leadership?

Is it too late to tilt a portfolio toward foreign stocks?
Active/Passive Return Drivers: July 2017 Update

Last July we published a study titled Active vs. Passive: A Three-Club Headwind that examined the recent performance advantage of passive indexes over actively managed funds.
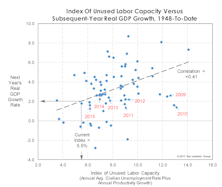
Boom/Bust Doesn't Point to Recession
.png?fit=fillmax&w=222&bg=FFFFFF)
The Boom/Bust Indicator, combines a market-based measure (commodity prices) with a weekly government report on the employment situation
Broad Participation = Broad Overvaluation

We’ve argued for many months that, across all of the U.S. stock market valuation work we monitor, there’s been only one chart that’s truly looked “bubbly”: the S&P Price/Sales ratio.
Does First Half Stock Market Strength Carry Over Into The Second Half?

Does the stock market’s first half performance tell us anything about its likely path in the second half? Not on the face of it.
Bonds And Aristocrats

One of this year’s many perplexing leadership trends has been the weak relative action of the once-coveted S&P 500 Dividend Aristocrats in the face of a solid bond market rally.
How Will The Expansion End?
Debate over the timing of the eventual end of the economic expansion is centered almost entirely on Fed policy. How fast will the Fed lift short rates? How and when will it begin to contract its balance sheet? And will these moves invert the yield curve?
Valuation "Gut Check"
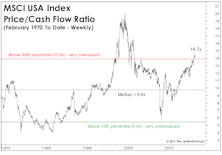
While our most reliable valuation work is based on the S&P 500 (and closely-related S&P Industrials Index), we monitor several other measures for substantiation and reinforcement.
Assessing Yesterday's New High
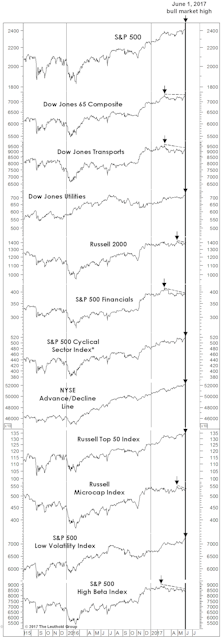
Traders like to say there’s nothing more bullish than a new price high, but not all new highs are created equal.
Bonds, Breadth, And Leadership: A Simple Model

Hard-core statisticians might be disappointed to learn that the 140-ish inputs in our Major Trend Index (MTI)aren’t entirely “independent and uncorrelated.”
Keep An Eye On This Spread

For years, the Cabot Market Letter has tracked a “Two-Second Indicator” that’s based on the number of NYSE New 52-Week Lows.
P/E Ratios and Forward Returns: An Update

While it’s not currently the most inflated measure among our Intrinsic Value readings, the S&P 500 P/E on 5-Year Normalized EPS has nonetheless just moved into its tenth historical decile. The latest reading of 23.6x ranks in the 93rd percentile of all observations dating back to 1926.