
Inside The Stock Market ...trends, cross-currents, and outlook
March Market Action

The moderate index level price moves from February month-end to March month-end didn’t give any indication of the wild swings that occurred during the days in between.
All Was Not Lost In Stocks' Lost Decade
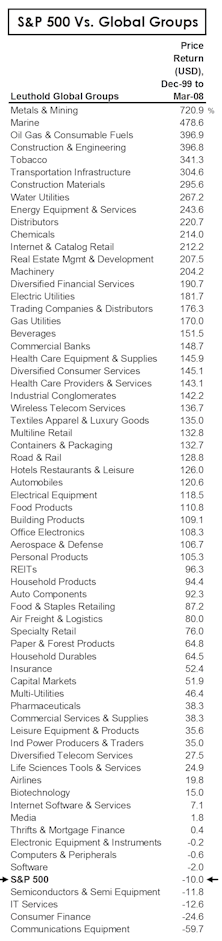
There’s much more to “the market” than the S&P 500.
Attitudinal Scores Among Highest Ever Recorded

Attitudinal category now very positive reflecting excess bearishness which typically comes near market bottoms.
Trying To Make Sense Of Earnings
Jim Floyd tries to makes sense of earnings in the current recessionary environment.
Current Stock Market Strategy

Market has so far performed pretty much as expected. Major Trend still Negative, but recent improvement is surprising. Bear market could be winding down.
Employment Data Continues To Deteriorate

At the risk of beating the “we’re in a recession” theme into the ground, we thought some analysis of the hot-off-the-presses March employment data would be worthwhile.
Profit Margins In Retreat....The Mathematics Of The Downside
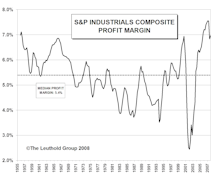
Profit margins contracting. Assuming margins fall back to median historical levels, this implies a market decline of about 18%.
Not As Bad As January...

First, let us be thankful February 29th only occurs every four years. No, we haven’t done a historical performance analysis of past leap year extra days, but you can be certain somebody now has. Whatever, it was a bad end to February 2008.
Housing Fallout: Here’s A “Window” That Isn’t Broken Or Boarded Up...
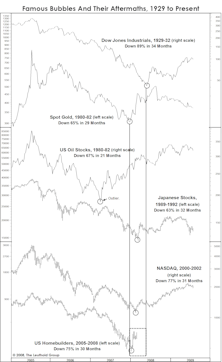
Following patterns of past burst bubbles, Homebuilders seem poised to rally.
Bear Market Bottom This Summer?

What follows is my attempt to accentuate the positive; why the current bear market may be maturing and bottoming out sooner than you might think.
Insider Block Measures...Insider Selling Has Slowed Considerably

The factor measuring “Big Block Insider (Dollar)” transactions is now rated positive.
The Median P/E Valuation Benchmark

When stocks get back to median valuation levels, the odds are the stock market is at or close to its lows.
Client Question: VLT Buy Signals

“Given the broad declines in the stock market since October 2007, are there any particular industry groups which are beginning to look washed out enough to trigger a buy signal on the VLT work you employ in your Group Selection Scores?”
Worth Noting???

What follows are my personal observations and opinions. I am an anti-inflation fiscal conservative and I know some would add “curmudgeon” to this description.
February Market Action

The stock market continued to trend lower in February, with most broad indexes posting losses in the 2%-3% range by month end.
The Economy And The Stock Market
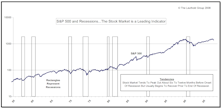
The stock market tends to peak out 6-12 months prior to recession but turns back up prior to the end of a recession.
Historical Sentiment Measures Not Showing Signs Of Bottom

In looking at Contrarian indicators compared to past major market lows, it seems today’s market has more room on the downside.
The Historical Significance Of Median P/E Valuations

70% of all the market declines since 1945 (post WWII), bottomed within 10% of the median historical normalized P/E ratio.
Playing The Bounce Final Update: Bounce Stocks Small Rally (Finally) In January

We did get a bounce stock rally in January, but it still was a disappointing bounce year overall.
Do You Believe In "Decoupling"

A popular buzz word in recent months is “decoupling”, often used in building a case for investing in fast growing foreign stock markets even though the U.S. economy is entering a phase of minimal economic growth or recession.