
Inside The Stock Market ...trends, cross-currents, and outlook
Valuations: The Correction That Never Was
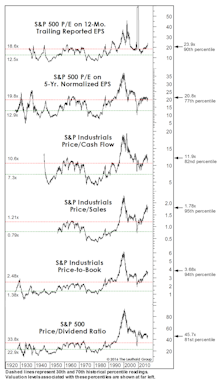
The correction failed to meaningfully “reset” any long-term valuation measures, hence, we don’t view the current environment as having much investment merit, but rather, primarily speculative appeal.
Thoughts On The Commodity Bounce

The global economic expansion will enter its eighth year later this summer, yet the world’s central bankers continue to fight deflationary demons as if it’s 2008.
Sell In May: Statistical Update
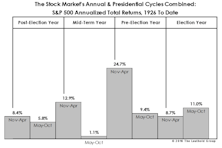
If this year’s interest in the “Sell In May” phenomenon is any indication, there remains plenty of skepticism surrounding the market’s recent rebound. The good news is that the “Sell In May” play has been weakest during presidential election years.
EM: Improved Sentiment But Macro Risks Still Dominate
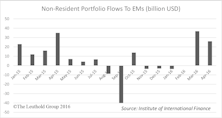
Positive forces may be transient. Be wary of EM’s high correlation to commodities and Chinese stocks.
Has The Hook Been Set?

Two months ago, we suggested a short-term bounce in oil might prove to be the fundamental “hook” that would rationalize a bear market rally. We thought a bounce to $45 might do the trick—and oil futures essentially cooperated, reaching $41.90 on March 22nd.
Stock Market Observations
The stock market rally off the February 11th lows has been powerful enough to lift the Major Trend Index into its Neutral zone (in fact, a high-neutral ratio of 1.04), and therefore certainly deserves some level of respect.
Ruminations On The Correction
If our market disciplines turn bullish in the weeks ahead, we’ll certainly follow that lead—covering remaining shorts, re-establishing a semi-aggressive market position, and wiping egg off our faces for having called a “cyclical bear market” that slammed the Russell 2000 (-26%), EAFE (-26%), and Emerging Markets (-37%)… but somehow not the one most followed, the S&P 500 (-14%).
Strength + Weakness = Weakness?
We like to think our models and indicators help us preserve a high degree of market objectivity. But sometimes we wonder: the latest rally has progressed to the point where we see trouble afoot in both the strongest and weakest charts we can find.
Improving Indicator Evidence
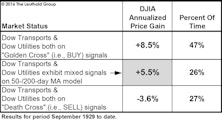
Last spring’s “Double Death Cross” in the Dow Transports and Dow Utilities had been partially reversed even before the February low, when the Dow Utilities’ 50-day moving average crossed above its 200-day moving average (thereby issuing a “Golden Cross”). The Dow Transports remain in a bear pattern based on the 50/200-day relationship, but the gap is closing fast.
Margins: Mean-Reversion Works
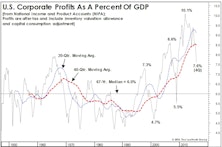
A late March issue of The Economist proclaimed “profits are too high” and “America needs a giant dose of competition.” Funny. NIPA Corporate Profits figures released that week show The Economist’s plea for lower profits had already been fulfilled—and not just in the latest quarter.
A Turn In Leadership?
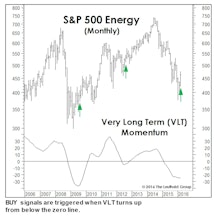
Last month we wrote that a big March gain would trigger a Very Long Term (VLT) Momentum BUY signal on the S&P 500 (Chart). The month’s 6.8% S&P 500 gain wasn’t quite enough to do the trick, but we’re intrigued that VLT did issue BUY signals for three of the market’s cyclical sectors, including Energy, Materials, and Industrials.
High Quality Stocks Slightly Underperform YTD
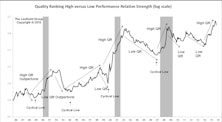
Even though Low Quality spends the majority of time outperforming, investors benefit exponentially from holding High Quality during the bad times.
Bear Market Rally Or New Upswing?

Richard Russell—who wrote Dow Theory Letters for almost 60 years before his death last year—observed that “bear market rallies look better than the real thing.”
Labeling The New Up-Leg

The short-term market surge certainly possesses the hallmarks of many previous bear-killers (or correction-killers)…but it also sports the look of many historical bear market rallies.
Ready For Year Eight?

Assuming—only for the sake of argument—the bull remains intact, its seventh anniversary will mark a rare case in which the market was lower than at its anniversary a year earlier.
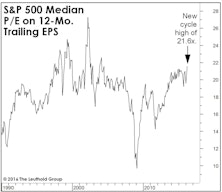
Another Look At Median Valuations
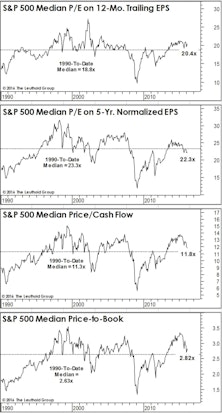
While the past several months’ reversion in valuation measures has certainly wrung some of the risk out of the market, if the bear market reasserts itself and drives stocks to valuations seen at average cycle lows, downside risks are still substantial.
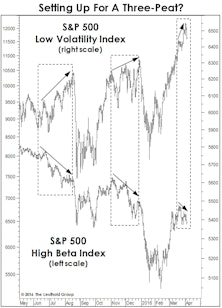
Beta Back In Vogue?
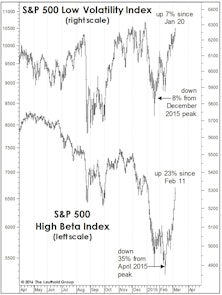
High Beta has certainly lived up to its billing, during both the multi-month decline and the three-week rally off the February 11th correction low.
Is Defense Overpriced?
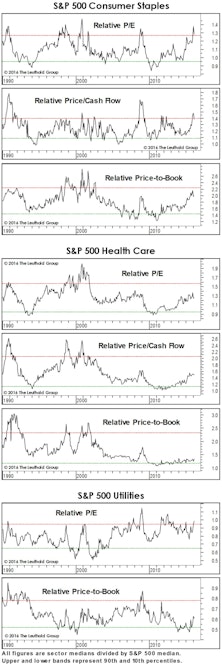
Relative valuations of Staples and Utilities sectors already reflect a “flight to quality” effect. Investors looking to add some economic/stock market defense should focus on the cheaper Health Care groups.
Foreign Stocks Set For A New “Bear”-ing?

Based on comparative valuations alone, one could have made a case for investing in foreign stocks over domestic ones as early as 2010—when EAFE’s valuations sunk to an historical low, relative to the S&P 500. Today, that gap remains extreme.
Where’s The Profit Leverage?

Industrial commodity prices and the latest ISM figures both point to a stabilization in the manufacturing sector following a two-year deceleration. Expectations for this year’s earnings have turned more optimistic as a result, but are the hopes warranted?