
Inside The Stock Market ...trends, cross-currents, and outlook
Real Bond Returns: Set To Flatline?

While a plunge into a recession could always result in a final “blow-off” phase to the 35-year secular bull market in bonds, any youthful, long-term buyer of 10-Year Treasurys should weigh that exciting possibility against the odds that bonds do no more than match the inflation rate over the next 30-50 years.
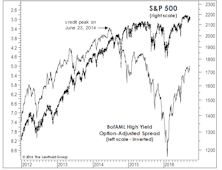
Can Companies Sustain Cash Payouts?

Companies are returning cash to investors at a level never before seen. Counting dividend payouts and outstanding share repurchases, the amount of cash returned back to investors crossed the $1 trillion mark for the first time in January 2016 (based on trailing twelve-months’ total for the largest 500 companies, Chart 1).
Earnings-Release Price Movement Among Sectors/Industries
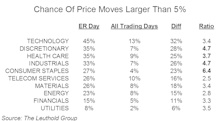
Earnings season is not only important for fundamental investors, it can be equally so for quant managers. For quants that incorporate fundamental data, like us, historical trends and changes in consensus estimates may weigh heavily on model output.
Only The Shadow Knows

If the above observation from almost a century ago remains on the mark (as it has for almost a century), then both the cyclical bull market and accompanying economic expansion should remain in force during the next several months.
Charts: Beware Of Myopia
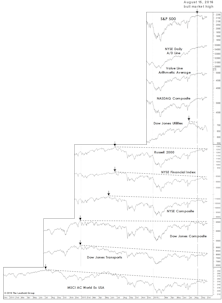
Despite a two-month stall in the blue chips, the breadth and momentum behind the market’s rally off mid-February lows remain hard to deny.
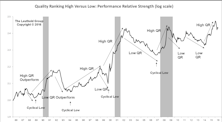
Beta Rotation Underway
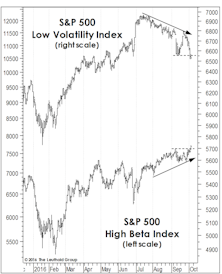
For months we’ve speculated that any major extension of the bull market would require a rotation into High Beta groups from the Low Volatility and economically-defensive themes that were the market’s big winners from mid-2015 to mid-2016.
Is The Crack In Utilities A Broader Market Warning?
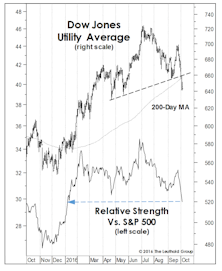
A few months ago, we mentioned the valuation risks that had built up in the stodgy Utilities sector, which at its mid-summer peak commanded a trailing P/E multiple of 24x—almost 10 points above its 1990-to-date median of 14.7x.
Financials: All’s Well If You Don’t Look Far
So long as one maintains a “nationalistic” perspective, Financial sector indicators support a bullish view toward both the economy and stock market.
Foreign Equities: Cure For Altitude Sickness?
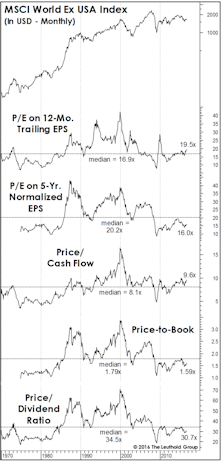
When we complain about the stock market’s inflated valuation levels, we’re unintentionally giving short shrift to the 50% of the global-market capitalization that resides outside the U.S. We’d be hard-pressed to describe the valuation of Developed foreign markets as any higher than neutral.
How To Beat The S&P 500 With The S&P 500
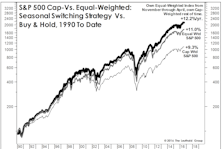
While 2016 is shaping up to be one of the most difficult years ever (on a relative basis) for active equity managers, one cannot blame the usual culprit of “narrow” market participation.
Tech: Prices (And P/E Ratios) Breaking Out

Technology has proven a bright spot in an otherwise disappointing year for our Group Selection (GS) Scores, and it sits atop the sector rankings for the third consecutive month as of October.
The Fog Of Uncertainty

Investing is, by its very nature, a forward-looking endeavor. The returns that are earned and the risks that are incurred by investments made today will only be determined tomorrow.
A Stock/Bond Relationship Revisited
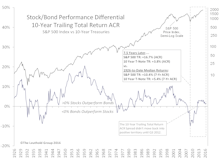
Herein we further explore this month’s theme of “point-in-time relationships” and subsequent market returns. We review and update a study we initially conducted and published in June 2009.
Low Quality Stocks Dominate
Investors brushed off a global economic slowdown and drove up the value of risky assets. Current low-quality leadership has been in place for eight months thus far.
Guidance & Price Movement On Earnings-Release Day

We study the effect of company guidance on ER-day price volatility. Do companies issuing more frequent and detailed guidance help to prevent big surprises on ER day?
How Will It All End?

Last month we described ourselves as “long on equities, but light on conviction,” and that description still applies.
Rotation Away From Low Vol?
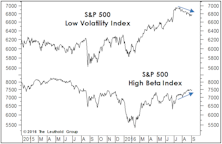
An encouraging break from a 15-month leadership pattern: Low Vol stocks have rolled over since mid-July, while the High Beta cohort has finally eclipsed its late-April highs.
In The Volatility “Sweet Spot”

Market anxieties have inched up over the last several weeks despite the proximity of all major indexes to cycle highs. The MTI’s Attitudinal category has improved by about 70 points in the past few weeks, and we sense more worry than usual over potential for turmoil in the seasonally-weak months of September and October.
Sizing Up Small Caps
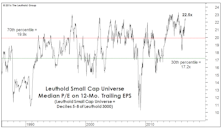
While the most inflated domestic-valuation readings are found in the Large Cap realm, the market rebound has driven the median 12-month trailing P/E in our Small Cap universe to 22.5x (Chart 1)—less than a point away from the June 2015 all-time high of 23.3x.
A Semi-Annual Checkup!
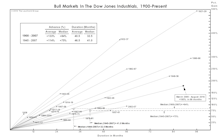
Call off the mortician, and bring on the pediatrician for the bull market’s 7 1/2-year checkup this month.