
Inside The Stock Market ...trends, cross-currents, and outlook
The Tab For “Freebies” Keeps Escalating

There’s an underlying faith that bureaucrats at the Fed and Treasury will keep good and bad businesses, alike, afloat—and overvalued. We’re still trying to unearth a single historical analog that merits such confidence.
Foreign Stocks Party Like It’s The “2010s”
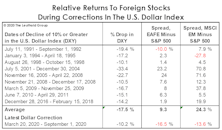
The most likely catalysts for improved relative performance of foreign stocks would be: (1) a bear market; (2) a recession; and, (3) a major downturn in the U.S. dollar. This year has supplied all three, yet the relative strength ratios of most foreign equity composites continue to grind lower as if it’s “business as usual.”
Does An Economic Rebound “Inoculate” The Stock Market?
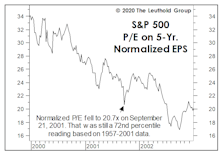
The 2020 decline exhibits a strong resemblance to the “incomplete” bear market of March 2000-September 2001—in that neither decline sufficiently deflated the extreme valuations of the preceding bull, and each was followed by an immediate rebound in reliable valuation measures to top decile levels.
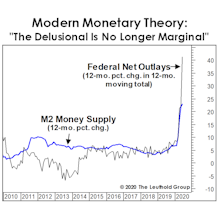
Can Money Growth Trump All Else?
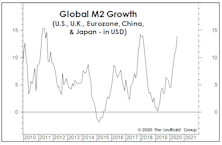
In 2019 and 2020, our regard for time-tested valuation tools resulted in tactical portfolios being underexposed to stocks during a pair of tremendous rallies. Now, the critique is that we don’t appreciate the brilliance of today’s policymakers and their miraculous ability to pivot just when the stocks (and, in the latest case, the economy) need it most.
Back To The Brink
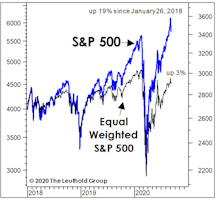
Despite equal-weighted measures’ long-time underperformance, all valuation ratios we monitor for the median S&P 500 stock have returned to their top historical deciles. Even worse, our new equally-weighted “Valuation Composite,” based on these measures, closed August at a 98th percentile reading.
An Unspoken Dilemma

Need more proof that we really are contrarians? While others were celebrating new all-time highs in the S&P 500 during August, we were wringing our hands over a disturbing new all-time low.
An Unwelcome Surprise?
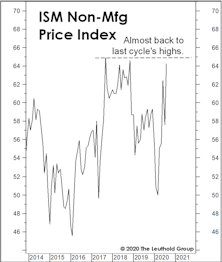
Several measures of U.S. economic “surprises” have soared to all-time highs in the last couple of months, showing that even economic forecasters have finally learned to play the corporate game of “under-promise then over-deliver.” Mind you, that’s only 30 years after most industrial firms eliminated the role of “staff economist.”
Free For All?
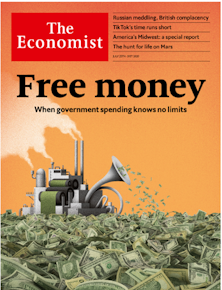
The weekly covers of The Economist do a pretty good job of capturing the zeitgeist of global financial affairs, but there’s so much packed into every issue (and enough to do around our shop) that sometimes all we see are the covers. But we have to admit we’re disappointed in The Economist for the week ended July 31st. The “Free Money” theme is at least four months too late!
Measuring The Cost Of “Free”
The S&P 500 and NASDAQ have lately traded as if the hybrid “Fed/Treasury put” entails no cost at all. But dollar alternatives—like forex, precious metals, and crypto-currencies—are saying, “Not so fast!”
Implications Of The “Breakout”

July’s developments led to us investigate the market valuations accompanying all past month-end S&P 500 breakouts which (1) eclipsed the prior month-end bull market high; and (2) made a new all-time high in the process.
After The “Thrust”…

We’re concerned that cyclical groups, which normally catch fire after a breadth thrust, are tracking along the bottom (or below) the previous worst-case outcomes following identical breadth-thrust signals.
Sentimental Musings
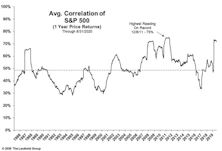
We get irked when TV pundits misrepresent the mood of equity investors as unduly pessimistic based one or two (or zero) data points. Among the dozens of “Attitudinal” indicators we track, an overwhelming majority show professional and retail investors have jumped back into the fray.
A Look At Two Historical Near-Misses

As we go to press (said no one in the digital age, ever!), the S&P 500 was moving to within a couple percentage points of its February 19th all-time high. Given still-high valuations for the blue chips and increasingly frothy sentiment, we think any break above that high will be underwhelming, if not a potentially historic “trap.”
A “Low-Risk” BUY?!?
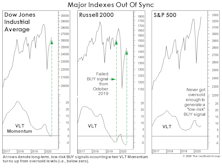
So what do we make of July’s “low-risk” VLT BUY signal on the DJIA—the index on which the indicator’s creator (Sedge Coppock) did his original work? Sadly, not much.
A “Litmus Group” For The Bulls

As troubled sectors vary from downturn to downturn, commercial banks have shown an uncanny ability to leap in front of each cycle’s proverbial pie truck. This time, it’s hard to identify the precise epicenter—especially amidst all the bailouts.
How To Value Gold
July’s surge drove the yellow metal to the brink of its overvaluation threshold, where only 150 ounces of gold are required to buy the median-priced existing home (currently about $299,000). Impressively, gold made all but the last month of this move without attracting mainstream attention.
Corporate Debt Continues To Pile Up
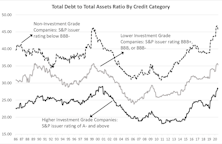
Public companies are loading up on debt. Since we wrote about this topic over a year ago, a few metrics have reached, or are surpassing, peaks of 1999-2000. When the readings move to extreme levels, we recommend readers take precautions.
Different Paths, Same Ending?
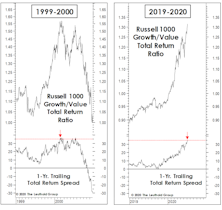
For those who believe the economy “drives” trends in stock market leadership, consider the cases of 1999-2000 and 2019-2020.
Everyone Loves A Winner
The bullish consensus seems to be that unlimited Fed liquidity will lift all stock market and economic boats. However, past liquidity floods have tended to lift boats that were already the most buoyant. The “Y2K Liquidity Facility” and last fall’s emergency Fed intervention in the overnight repo market are two cases in which liquidity seemed to flow to where it was needed the least.