
Stock Market Internals Earnings Momentum, Small/Mid/Large Caps, Growth/Value/Cyclicals, and Additional Factors
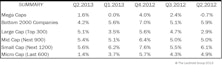
Q2 Median Company Earnings Growth Rates Vary Drastically Across Cap Size
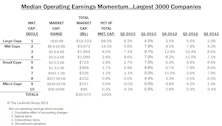
EPS growth for Large and Mid Cap companies continues exceeding their top-line growth, but Small and Micro Cap companies saw their EPS growth rates coming in below their top-line growth rates.
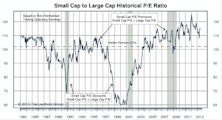
Small Cap Premium Remains 15%
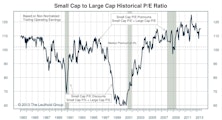
Small Caps are selling at a 15% valuation premium relative to Large Caps, using non-normalized trailing operating earnings. This is the same as the past two months’ readings. Using estimated 2013 operating earnings, Small Caps are selling at a higher valuation premium of 23% (24% last month).
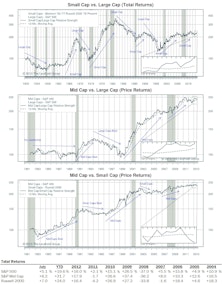
Small Caps Lead Year-To-Date
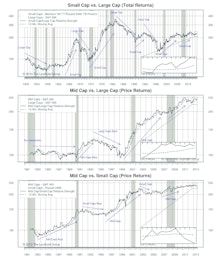
Large Caps lost 2.9% (total return) in August, just ahead of Small Caps (-3.2%) and Mid Caps (-3.8%). YTD, Small Caps continue to perform ahead of the other two subsets.
Growth Continues Leading In Mid And Small Caps YTD But Lags In Large Caps

Growth’s leadership over Value has only been apparent in Large Caps, but this segment had a big short-term reversal in recent months. Large Cap Cyclicals (+7%) significantly lag Large Cap Growth (+17%) YTD.
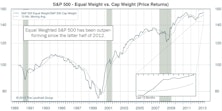
S&P 500: Equal Weighted Outperforms In August & YTD

The Equal Weighted S&P 500 (-3.0%) slightly outperformed the Cap Weighted S&P 500 (-3.1%). The Equal Weighted index continues outperforming YTD (+17.7% vs. +14.5%).
Minimal Sector Weight Changes Across The Capital Tier Indices

Financials (the largest Mid and Small Cap sector) decreased across all three market segments, while Information Technology (the largest Large Cap sector) was boosted for both Large and Small Caps.
Up/Down Earnings: Q2 Reports Start Below Average But Ahead Of Q1
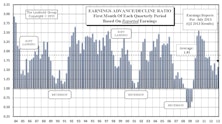
The first month of Q2 reports looks better than feared with a reading of 1.59. This is below the average of 1.81, but given this earnings season’s low expectations, investors should breathe a sigh of relief.
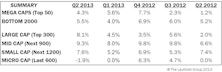
Q2 Median Revenue Comparisons: Higher Growth In Large And Mid Caps
Q2 relative to Q1 growth rates have improved for larger cap companies but deteriorated for the smaller firms.
Key Observations On Q2 S&P 1500 Earnings
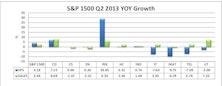
Year-over-year EPS growth rate for companies with Q2 reports (with about 65% in) currently stands at +4.2%, while revenue growth has come in at a better than expected +2.6%.
Small Cap Premium Remains 15%
Small Caps are selling at a 15% valuation premium relative to Large Caps, using non-normalized trailing operating earnings. This is the same as last month’s reading. Using estimated 2013 operating earnings, Small Caps are selling at a higher valuation premium of 24% (25% last month).
Small Caps Lead Year-To-Date
Large Caps gained 5.1% (total return) in July, lagging Small Caps (+7.0%) and Mid Caps (+6.2%). YTD, Small Caps are now ahead of the other two subsets, and Large Caps are the laggards.
Growth Leads In Mid And Small Caps But Lags In Large Caps

Growth’s longer term trend of leadership over Value has only been apparent in Large Caps, but this segment had a big short-term reversal in Q2 and July.
S&P 500: Equal Weighted Outperforms During July
The Equal Weighted S&P 500 (+5.4%) outperformed the Cap Weighted S&P 500 (+4.9%) and also continues to outperform on a YTD basis.
Dissecting The Capital Tier Indices

Consumer Discretionary’s weight increased the most in the S&P 500, rising 0.5%. Health Care rose the most in Mid Caps (+0.3%), while Information Technology rose the most in Small Caps (+0.7%).
Growth Leads In Mid And Small Caps In Q2 But Lags In Large Caps

Growth leadership over Value has only been apparent in Large Caps, but this segment had a big short-term reversal in Q2.
Q1 Median Company Earnings: Growth Rates Positive But Below Past Quarters

Sequential growth rates are all down this earnings season, but Micro Caps have been hit particularly hard exhibiting zero bottom-line growth.
Dissecting The Capital Tier Indices
Information Technology sector weight declined across all market tiers, including a 0.4% drop within the S&P 500. However, it remains the largest sector weighting among Large Caps. Financials remain the heaviest weight for both Mid and Small Caps.
S&P 500: Equal Weighted Outperforms During June

The Equal Weighted S&P 500 (-1.3%) slightly outperformed the Cap Weighted S&P 500 (-1.5%) and continues to outperform YTD.
Small Caps Outperform In June
Large Caps lost 1.3% in June, lagging Small Caps (-0.5%). Both fared better than Mid Caps (-1.9%). YTD, Small Caps are now ahead of the other two subsets.