
Inside The Stock Market ...trends, cross-currents, and outlook
Low P/E Track Record
The “robustness” of the “Cheapest Sector Strategy” concept is illustrated by strong results across all rebalancing frequencies.
How Will It Be Remembered?
A way to gain perspective on the present is by trying to view it from the future. Ask yourself, “What are the signs of impending decline, now ignored by investors, that will one day be memorialized by the same investors as the most obvious in retrospect?”
A Tough Tape To Read
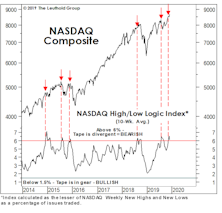
Over the nearly two years since the stock market’s “momentum” peak in January 2018, the S&P 500 has gained less than 9%, while the Value Line Arithmetic Composite is unchanged. Mid Caps and Small Caps have made no upside progress during this period and most foreign markets are down.
Are Stocks And The Economy Disconnected?
The consensus among market pundits is that a U.S. recession will be averted and, as a consequence, domestic stocks remain the best game in town.
Lagging From Behind?
As Yogi Berra might have quipped, it’s not just the leading indicators that are lagging… the lagging ones are, too.
A “Best Case” Bear Scenario?
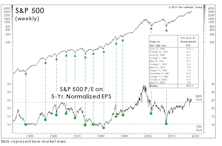
We intentionally curtailed our discussion of stock market valuations the last few months to allow the “dead horse” to recover from the thrashings administered in recent years. Now we’re rested, refreshed, and ready to deliver a few more lashes.
Risks Still High In The “Median” Large Cap
The relative domination of Mega Caps might leave the impression that valuation of the “typical” (or median) Large Cap stock is reasonable. It’s not. The fall rally leaves all major valuation ratios for the median S&P 500 stock in the top decile of the 30-year history, and above the levels prevailing at the September 2018 market high.
More Good News For Small Caps
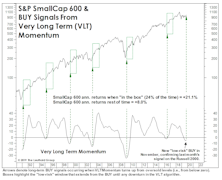
Our call for improved relative performance in Small Caps received another boost in November, when VLT Momentum for the S&P SmallCap 600 confirmed the prior month’s “low-risk” BUY signal on the Russell 2000.
A New Take On Small Cap Valuations
For valuation work, we’ve traditionally favored the 1,200 company Leuthold Small Cap universe over the S&P SmallCap 600 because we get almost a full additional decade of perspective. But figures for the latter shed extra light on just how significant the revaluation in Small Caps has been.
No Place Like Home For The 2010s
We thought we’d get a jump on all the “End of the 2010s” retrospectives you’re sure to see next month. Though not quite yet the official end of the decade, the changing of the “tens” digit definitely has a certain gravitas to it.
Capex Beneficiaries “Delivered,” But Only On Price Action
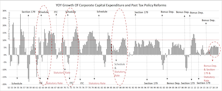
With optimistic views on capex in late 2017, we built a thematic group of companies that appeared to be potential beneficiaries of higher spending going forward. This group has outperformed the market; but, the capex trend is disappointing and quite concerning.
Can New Reins Take Hold Of An Old Bull?
Three months ago, Large Cap Growth and Momentum were the winning ways to play the market; the long-time resiliency of these entrenched leaders was a cornerstone of the bullish case. Suddenly it’s Value and Deep Cyclicals leading, anything possessing Momentum, of late, has turned toxic. Ironically, this “new” leadership is now the foundation for the bullish reasoning.
Monetary Musings
Among six major monetary gauges, five are now graded bullish, compared with just three a few months ago, and zero at the end of 2018.
VLT Complicates The Market Puzzle

At October’s close, a long-term BUY signal was triggered on the Russell 2000. The fact that some market segments are triggering “oversold BUYS” when blue chips are at record highs speaks volumes about the internal disparities that have developed during the last few years. The Russell BUY signal is not inconsistent with our belief that the action since the January 2018 peak remains part of a lengthy cyclical topping process.
Back To Y2K?

The bull market took out another old record last month when the S&P 500 topped the cumulative total return of the 1949-56 upswing. The total return since March 9, 2009, is now 468%. Since the highs of March 2000, the S&P 500 cumulative total return is actually a few basis points behind U.S. 10-year Treasury bonds.
A Short-Term S&P Top?
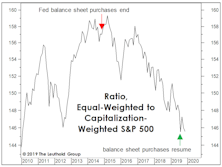
The short-term path for equities “looks” clearer than at any point in 2019, with economic data having stabilized a bit in the last few weeks, the Fed having cut rates again and resumed balance sheet purchases, and some type of trade deal finally looking more tangible than a 2:00 a.m. Tweet.
Simple Bond Model Says “SELL”
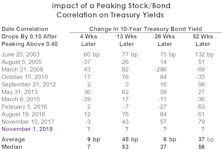
In our minds, the big story is not the nominal new highs in the blue chips, but rather the rapid changes now occurring on both an “intra-market” and “inter-market” basis. In the case of the latter, we have an important new signal from a simple correlation model we developed earlier this year.
Jury Is Still Out On EM

Emerging Market stocks have been swept up in the last month’s rally in all things cyclical and high beta. Nonetheless, the MSCI Emerging Markets Index is still down marginally from its level coinciding with its April 30th VLT BUY signal.
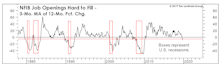
Labor Cost Observations
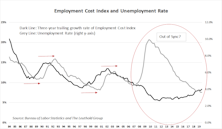
We take a look at different data sets reflecting labor costs. The main finding is that using Unit Labor Cost as the measurement for the true cost suggests that the labor market is very tight in terms of affordability for businesses.
The Last “Spoos” To Drop?

For many months, we’ve argued that global stocks have been tracing out a major cyclical top. But the global stock market “tape” has narrowed so much that it’s really only the U.S. blue chips that are left to do the tracing.