
Inside The Stock Market ...trends, cross-currents, and outlook
VLT Says Stocks Are Finally Oversold

The 2022 bear market has unfolded in a way that’s finally driven our Very Long Term Momentum algorithm for SPX into oversold territory for the first time since 2016. However, that only means a “low-risk BUY signal” is now mathematically possible—we could be writing about the “impending BUY” for many months to come.
Supercharging VLT With Small Caps

Leuthold did not invent VLT. The credit goes to Sedge Coppock, a technical analyst who insisted on being called an “econometrician.” While the famed Coppock Curve was based on the Dow Jones Industrial Average, Leuthold found the algorithm useful at the industry group level—it is a component within our Group Selection (GS) Scoring system.
Seasonal Nightmare Ending?

We’ve reminded dejected readers throughout 2022 that this year was statistically “cursed” from the onset. It’s a year ending in “2” and a Shmita year on the Jewish calendar, both of which have been associated with far below average stock market returns. More importantly, it’s a midterm election year, traditionally the weakest of the four-year cycle.
Cash, not Charles, is Finally King

Diversification has acquitted itself poorly in precisely the type of rough patch its proponents have been hoping for. So have some popular market-timing strategies, unless one has applied them across multiple asset classes.
No Rest For The Weary
If there’s a polar opposite to “Goldilocks,” this must be it. Not too hot and not too cold? What about both? Job growth and inflation are hot enough to force the Fed to follow through on its hawkish promises. But the leading indicators continue to warn us of oncoming cold. The odds that the porridge settles at the right temperature, without an intervening recession, look longer by the day.
Tightening Into A Slowdown: Month Seven
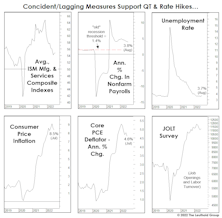
An economy can slow to a standstill on a “real” basis while growing rapidly in nominal terms; it happens in emerging economies all the time. But this dichotomous condition now afflicts most of the developed world.
A Year That Was Cursed From The Start

In January we put it bluntly: “Longer-term time cycles don’t line up for a prosperous 2022.” Not only is it a mid-term election year, but also a Shmita Year. Eight months later, the S&P 500 loss through August has exceeded 10% for only the twelfth time since 1926.
Fake-Out Or Break-Out?

“Don’t fight the Fed” was profitable advice dispensed almost daily by bulls in the 2nd half of 2020 and all of 2021. It’s been valuable advice in 2022, as well. However, when the Fed turned hostile earlier this year, the bulls deviated from their own sound advice and looked for new narratives.
From “Thrust” To “Bust” In Three Weeks
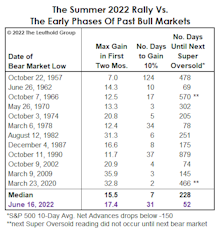
If a new bull began in June, the August 31st “super-oversold” signal would be the first ever during the first three months after a bear market low. In 1962, such a reading occurred in the bull’s fourth month—which is probably why some analysts are now using that year as a possible analog for the rest of 2022.
Labor Is The Limiting Factor
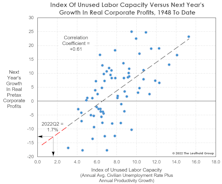
If the economy slips into recession, the Fed will get all the blame. But it’s worth taking a step back to consider that the die has already been cast: The “capacity” for the U.S. economy to grow is nearly exhausted. Specifically, we’re referring to the capacity available in the labor market.
It’s Been Ugly Across The Board
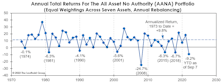
Aside from a couple specialized approaches, 2022 is shaping up as the second-worst year for “multi-asset” investing since at least 1973. It seems money printing supported more than just the equity subset.
Another Stab At The “Downside”
How far might the S&P 500 fall in a recessionary bear market? The 2002 and 2020 stock market lows were both produced by “recessionary” bears; based on history back to the 1920s, those two lows stand out as the priciest bear market bottoms on record—and it’s not even close.
Overheated?

Living in Minneapolis, we’re bewildered by the absence of research considering global warming as potentially a good thing for certain organisms. That’s especially true for creatures where the science is almost nonexistent—like the stock market. Record heat wave? Bring it on!
“Toro Nuevo” Or Mirage?
While our breadth measures do not consider this rally to be thrust-worthy, when based on nothing more than performance, it’s difficult to distinguish between the “first up-leg” in a new bull market and a bear-market rally. The vital signs at present appear to be more in-line with the latter (although making that conclusion based on price action, alone, is hardly better than a coin toss).
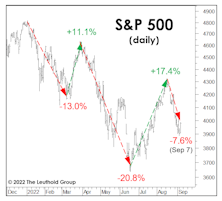
Bear Market Rallies In Context
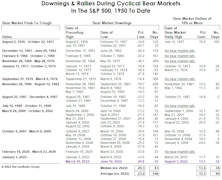
The 2022 bear market is the 13th cyclical bear since 1950, and it’s already joined the mightiest half of its predecessors based on the fact that it’s actually contained a bear-market rally. Six of the prior 12 bear markets weren’t interrupted by even one rally of at least 10%.
LEI On The Precipice

The LEI’s 3.6% six-month annualized loss through September 2006 was the largest decline not followed almost immediately by a recession. This year, the LEI contracted by 3.7% over the six months through June—if a recession is avoided in the current experience, it would be the most misleading signal in the history of the LEI as currently constructed.
The Yield Curve: Two “Perfect Records” At Stake
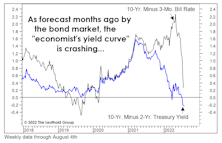
Yield curve action is getting harder to dismiss by the day. But which curve is the most relevant? We tried to answer that question in disciplined fashion in April. To our surprise, the “2s10s” spread that’s ubiquitous in bond-land scored near the bottom of the pack.
Job Market Suddenly “Laboring”
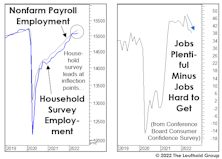
We cringe when we hear the Treasury Secretary or a regional Fed bank president dismiss the possibility of recession on the basis of “low unemployment and strong job gains.” Those measures are as “laggy” as any economic statistics the government publishes.
Valuations: Living Beyond One’s Means?
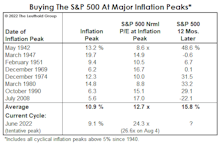
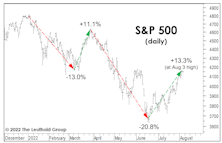
We won’t dispute that investors were not genuinely frightened at the June market lows, or that fears have evaporated following a 13% rally in the S&P 500. The distress is understandable: For 26 traumatizing days in 2022, our S&P 500 Normalized P/E multiple traded below its 1957-to-date top decile!
Confidence Cracking?
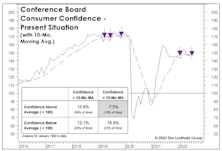
The theory of “contrary opinion” is important to market analysis, but so is an understanding of its limitations. When investor-sentiment surveys dipped sharply in late January, we warned that the declines (which are usually signals to “buy”) might instead mark the beginning of an important trend change.