
Sentiment Chart Packet Published on October 8, 2025
- PDF for printing
- PNG for use in an e-mail or on a website
- EMF for use in Microsoft Office applications
- CSV for data used in the chart
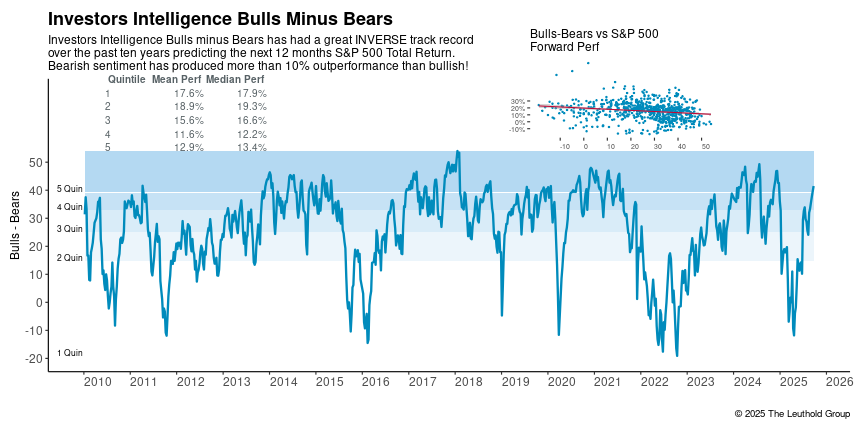
Investors Intelligence surveys some 140 financial newsletter writers to determine whether they are leaning bullish or bearish in their opinions to subscribers. The resulting Investors Intelligence Survey compiles the data to arrive at a weekly percentage of bulls v.s. bears.
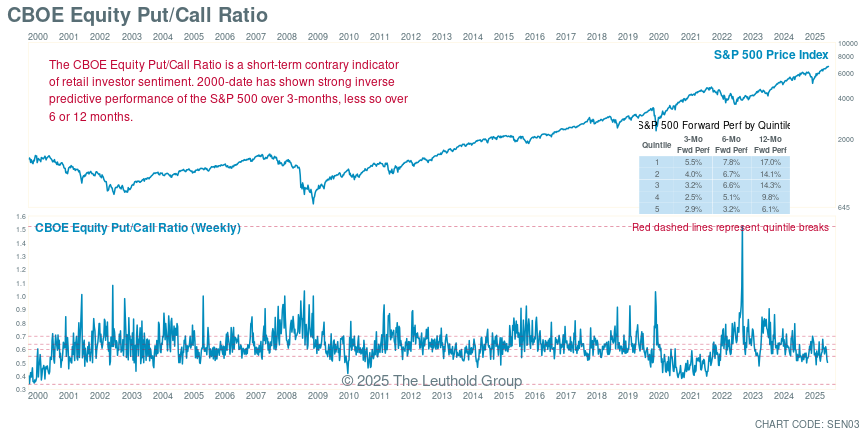
Put/call ratio is a technical indicator demonstrating investors' sentiment. The ratio represents a proportion between all the put options and all the call options purchased on any given day. This chart shows the ratio of the weekly sum of each measure.
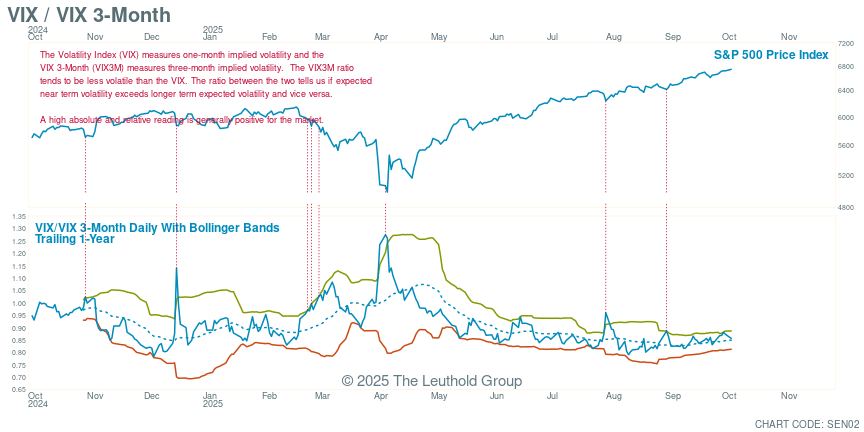
A Ratio of 1-month to 3-month S&P 500 Implied Volatility (i.e., the VIX/VIX3M ratio). This is a good measure of short-term sentiment swings
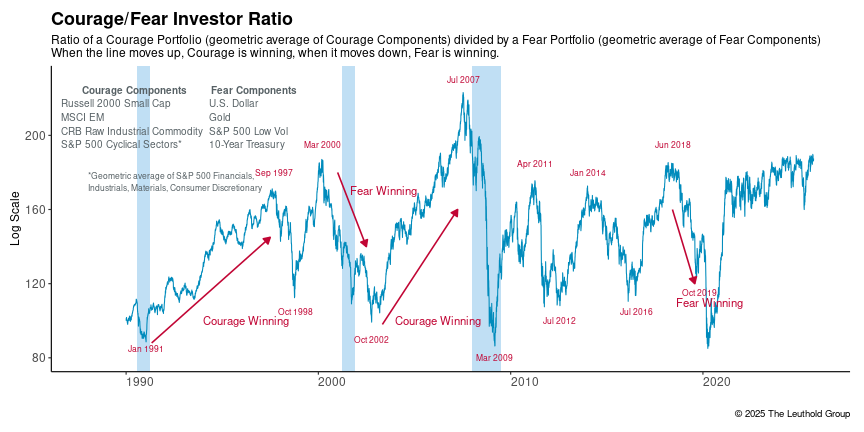
Ratio of a Courage Portfolio (geometric average of Courage Components) divided by a Fear Portfolio (geometric average of Fear Components). When the line moves up, Courage is winning, when it moves down, Fear is winning.
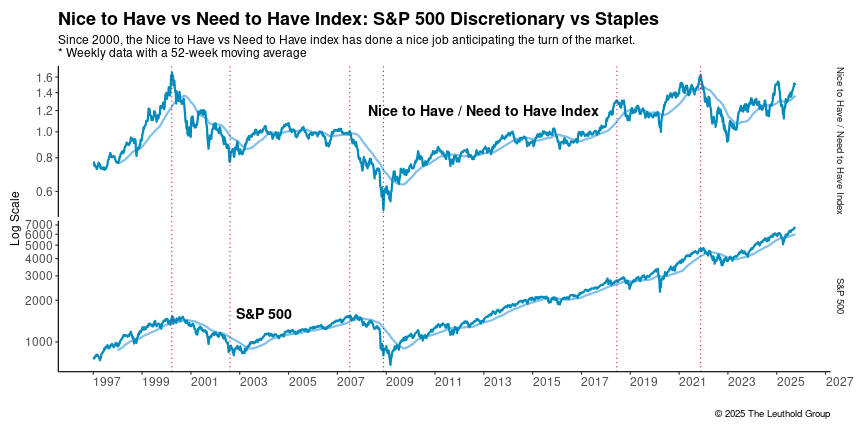
Weekly data with a 52-week moving average of the S&P Consumer Discretionary / S&P Consumer Staples.
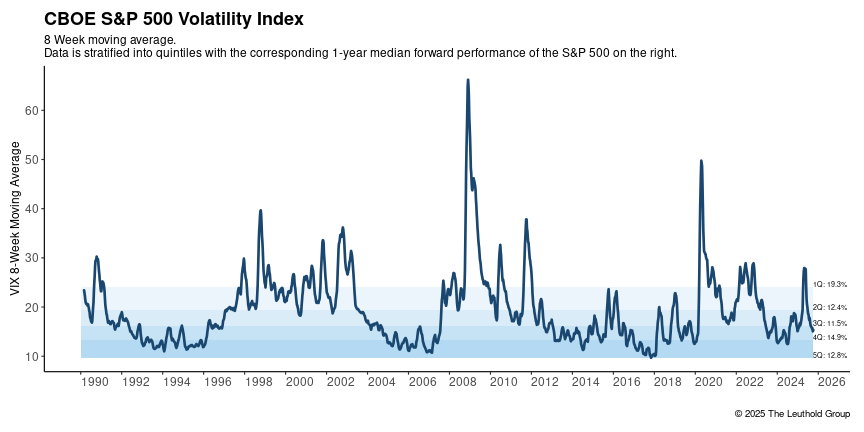
8 Week moving average of the S&P 500 Volatility Index