
Price and Momentum Chart Packet Published on October 8, 2025
- PDF for printing
- PNG for use in an e-mail or on a website
- EMF for use in Microsoft Office applications
- CSV for data used in the chart
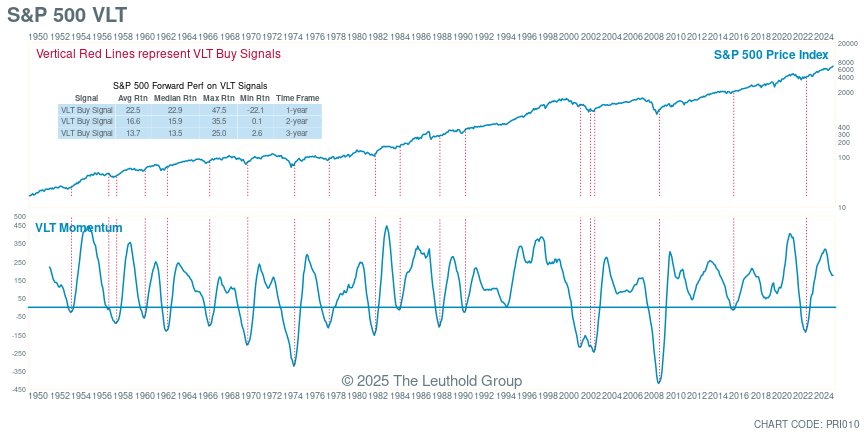
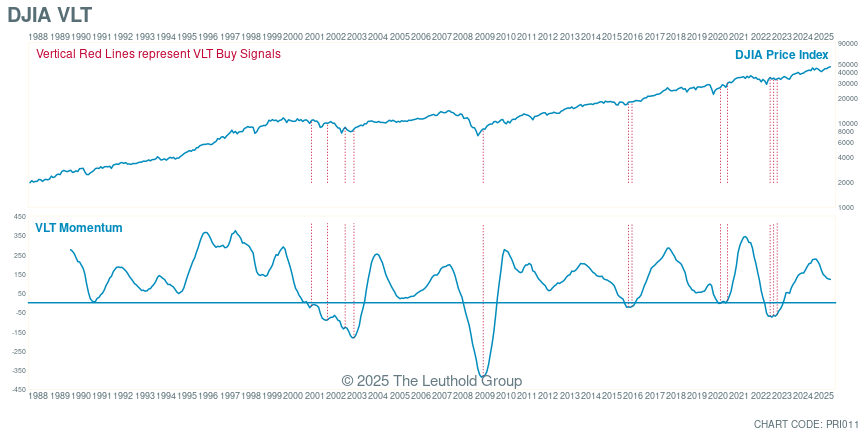
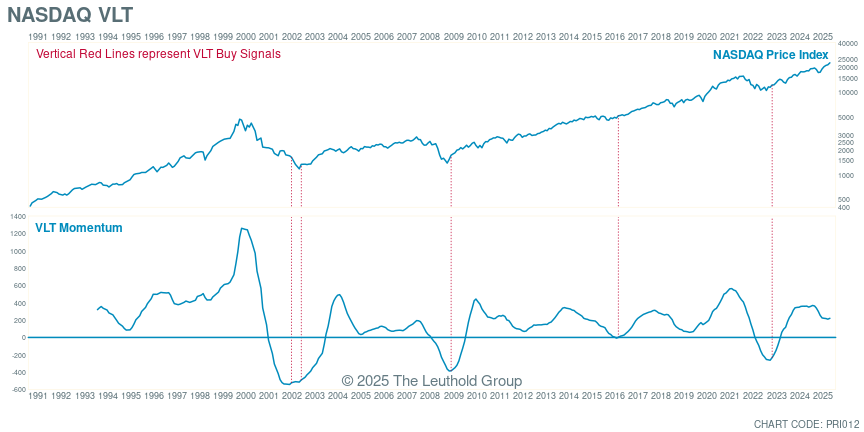
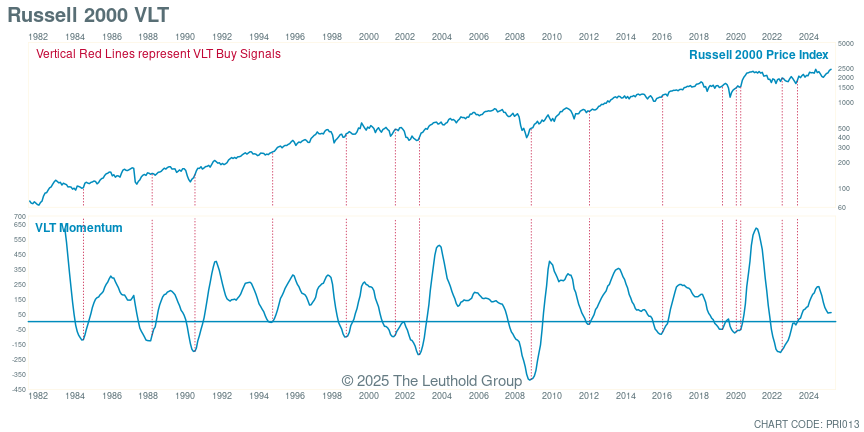
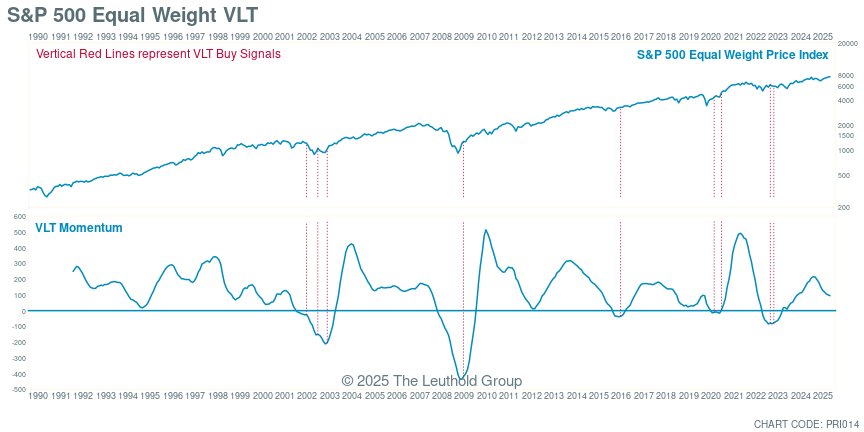
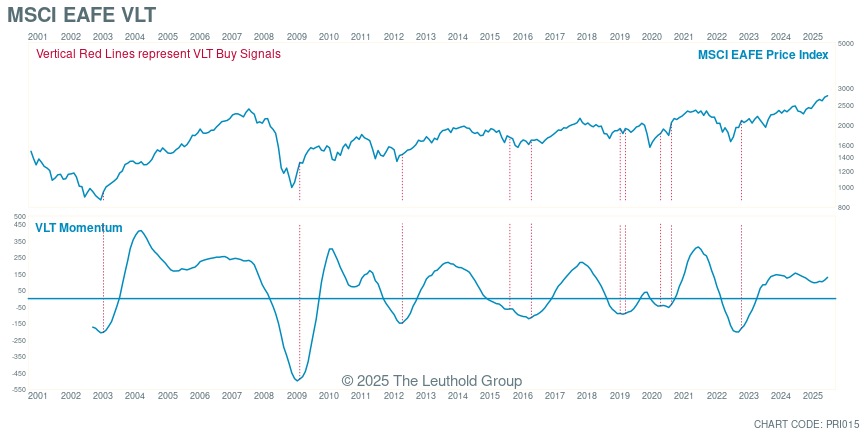
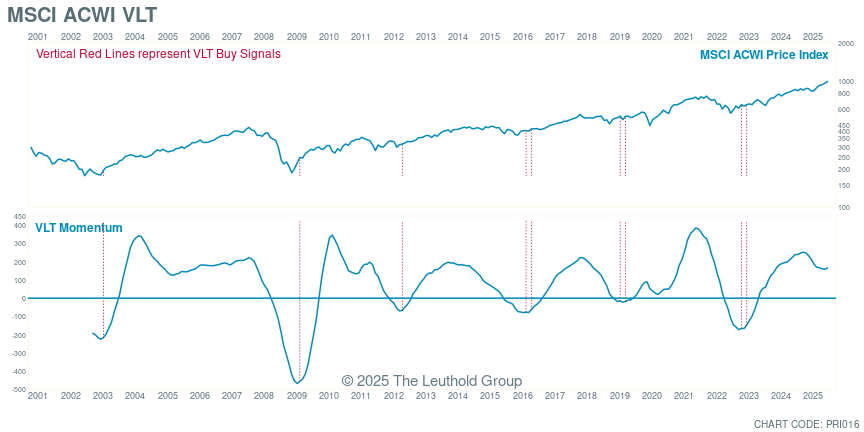
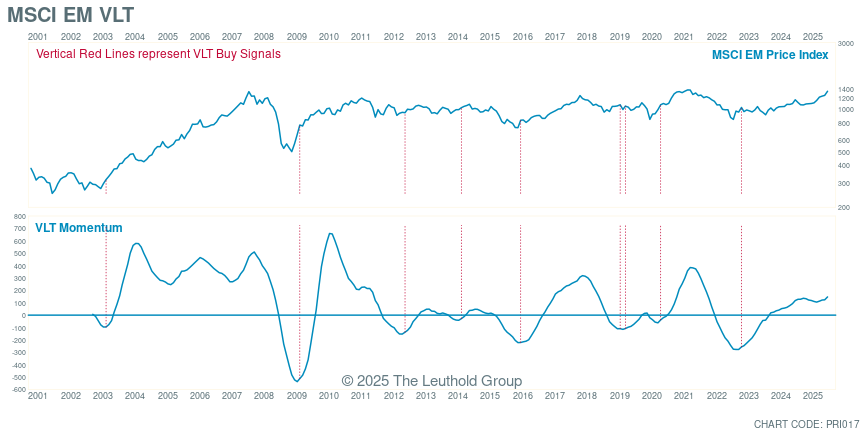
VLT (Very Long Term) charts are primarily used for identifying good long-term, low-risk buying signals in the stock market through the VLT Momentum indicator. When the VLT Momentum curve is below zero and begins to turn upward, it indicates a buy signal. However, VLT is not as effective in providing sell signals.
VLT (Very Long Term) charts are primarily used for identifying good long-term, low-risk buying signals in the stock market through the VLT Momentum indicator. When the VLT Momentum curve is below zero and begins to turn upward, it indicates a buy signal. However, VLT is not as effective in providing sell signals.
VLT (Very Long Term) charts are primarily used for identifying good long-term, low-risk buying signals in the stock market through the VLT Momentum indicator. When the VLT Momentum curve is below zero and begins to turn upward, it indicates a buy signal. However, VLT is not as effective in providing sell signals.
VLT (Very Long Term) charts are primarily used for identifying good long-term, low-risk buying signals in the stock market through the VLT Momentum indicator. When the VLT Momentum curve is below zero and begins to turn upward, it indicates a buy signal. However, VLT is not as effective in providing sell signals.
VLT (Very Long Term) charts are primarily used for identifying good long-term, low-risk buying signals in the stock market through the VLT Momentum indicator. When the VLT Momentum curve is below zero and begins to turn upward, it indicates a buy signal. However, VLT is not as effective in providing sell signals.
VLT (Very Long Term) charts are primarily used for identifying good long-term, low-risk buying signals in the stock market through the VLT Momentum indicator. When the VLT Momentum curve is below zero and begins to turn upward, it indicates a buy signal. However, VLT is not as effective in providing sell signals.
VLT (Very Long Term) charts are primarily used for identifying good long-term, low-risk buying signals in the stock market through the VLT Momentum indicator. When the VLT Momentum curve is below zero and begins to turn upward, it indicates a buy signal. However, VLT is not as effective in providing sell signals.
VLT (Very Long Term) charts are primarily used for identifying good long-term, low-risk buying signals in the stock market through the VLT Momentum indicator. When the VLT Momentum curve is below zero and begins to turn upward, it indicates a buy signal. However, VLT is not as effective in providing sell signals.
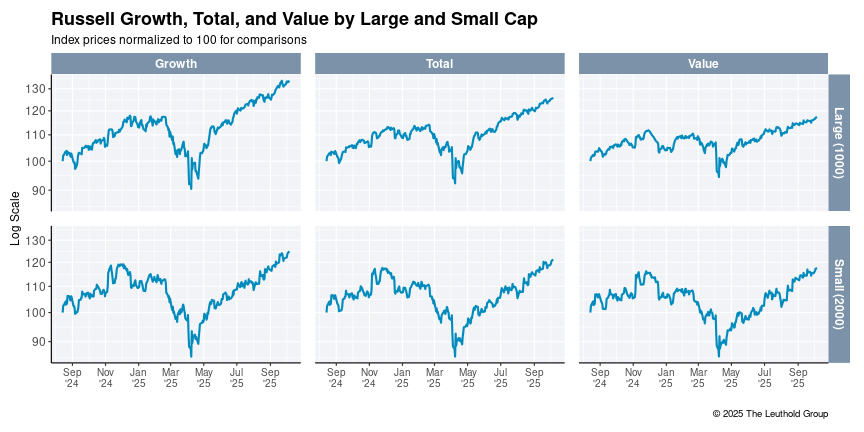
Year to date price performance grid of Growth/Value/Large/Small
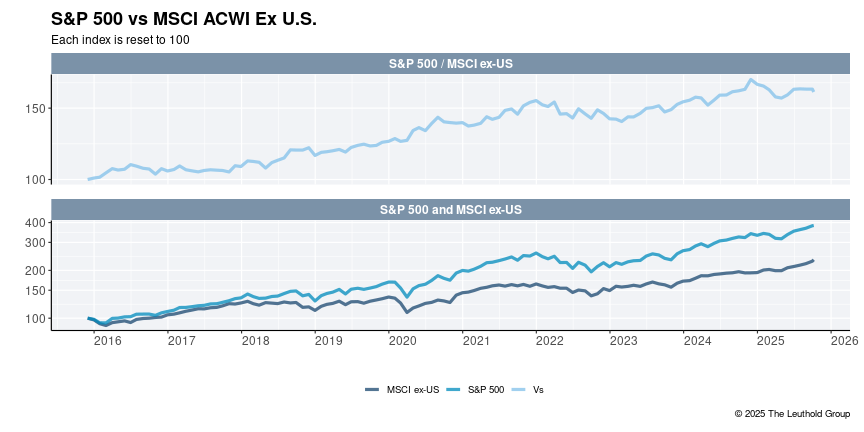
This chart shows the relationship between the U.S. and global (non-U.S.) markets over the last ten years.
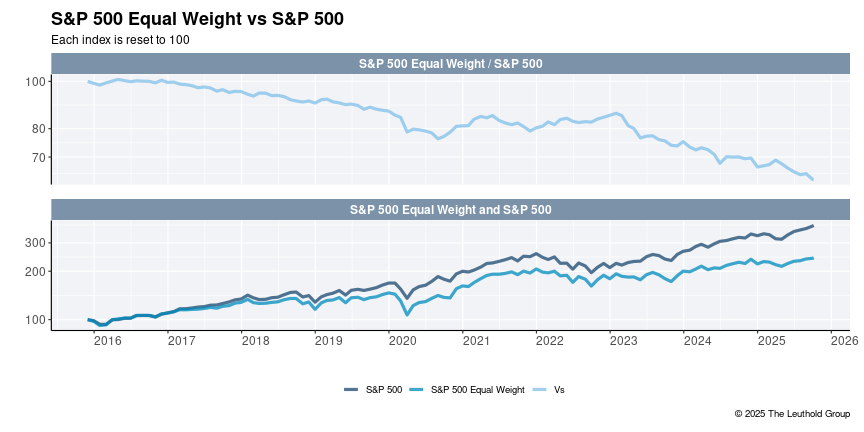
This chart shows the relationship between the S&P 500 cap weighted vs. equal weighted indexes.
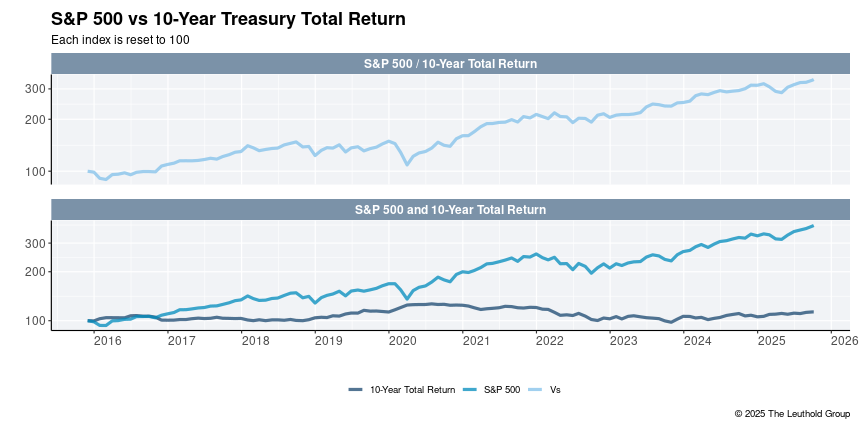
This chart shows the relationship between the S&P 500 vs. the 10-Year Treasury Total Return indexes.
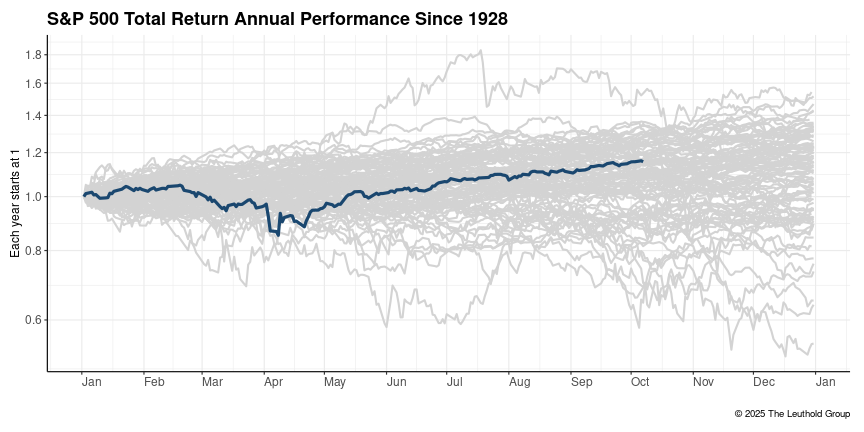
A look at every year of the S&P 500 Total Return since 1928 starting at January through December.
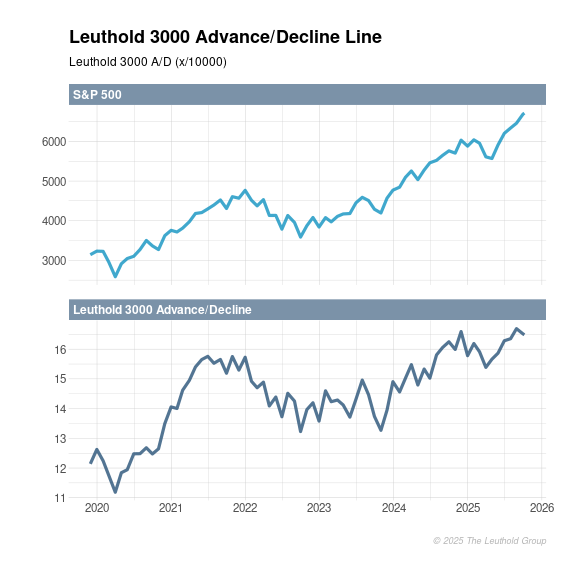
The advance/decline line, often referred to as the A/D line, is a technical indicator used to measure of market breadth by tracking the number of advancing (gaining) stocks versus the number of declining (losing) stocks within a given market index.
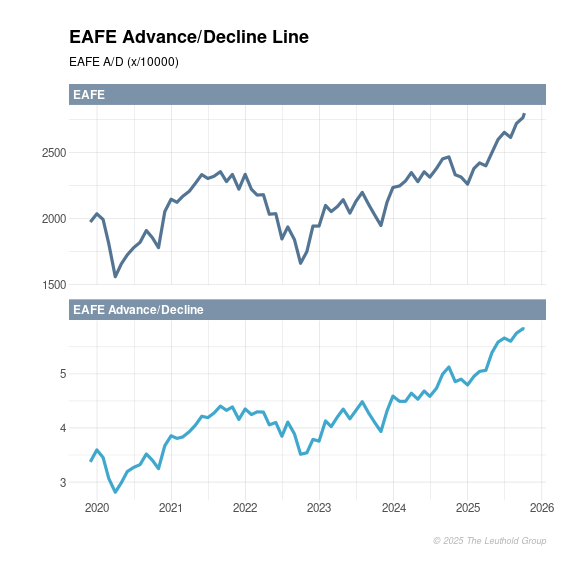
The advance/decline line, often referred to as the A/D line, is a technical indicator used to measure of market breadth by tracking the number of advancing (gaining) stocks versus the number of declining (losing) stocks within a given market index.
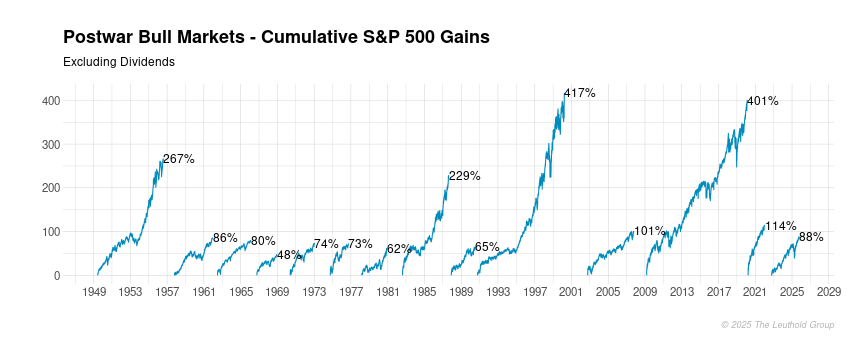
Among the four postwar bull markets that saw at least a 200% gain in the S&P 500, three began with Normalized P/E readings in the single digits. They include the ones begun in June 1949 (9.2x), August 1982 (7.4x), and March 2009 (9.9x). However, the greatest of the postwar bull markets—the 417% gain from October 1990 to March 2000—launched from a considerably higher Normalized P/E of 14.7x.
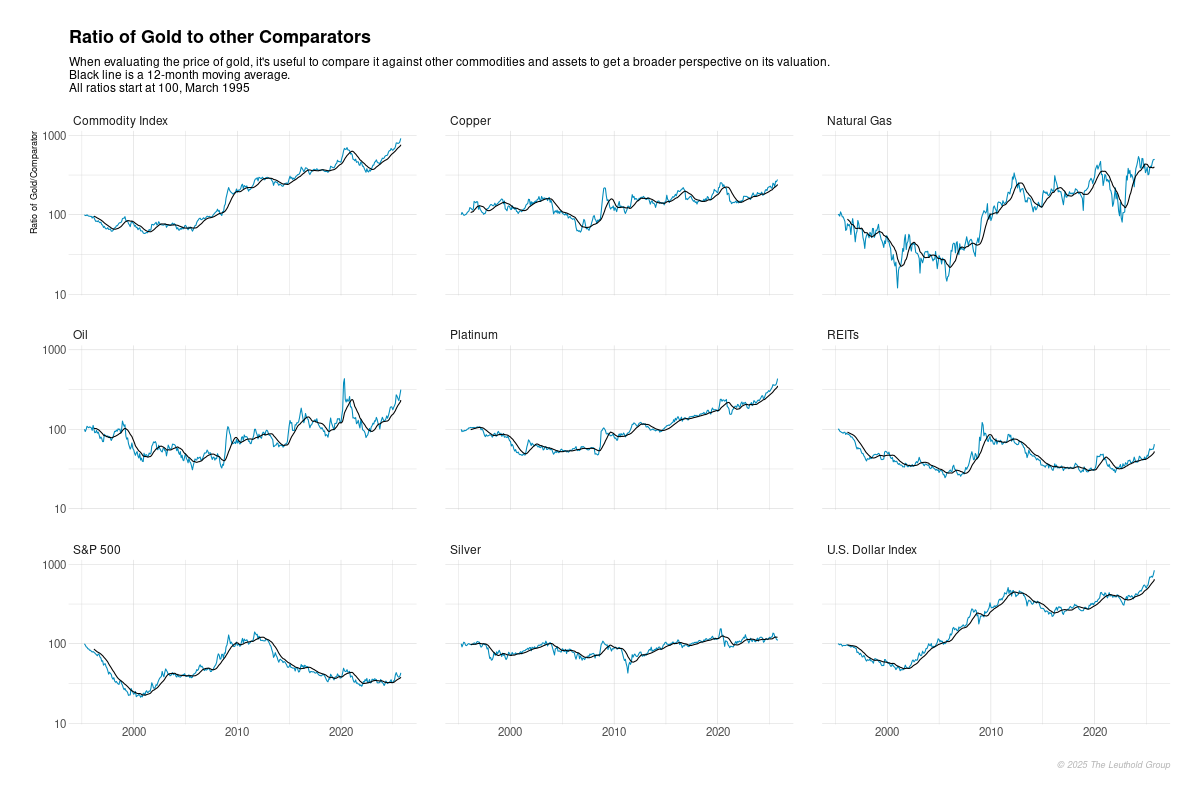
When evaluating the price of gold, it's useful to compare it against other commodities and assets to get a broader perspective on its valuation.
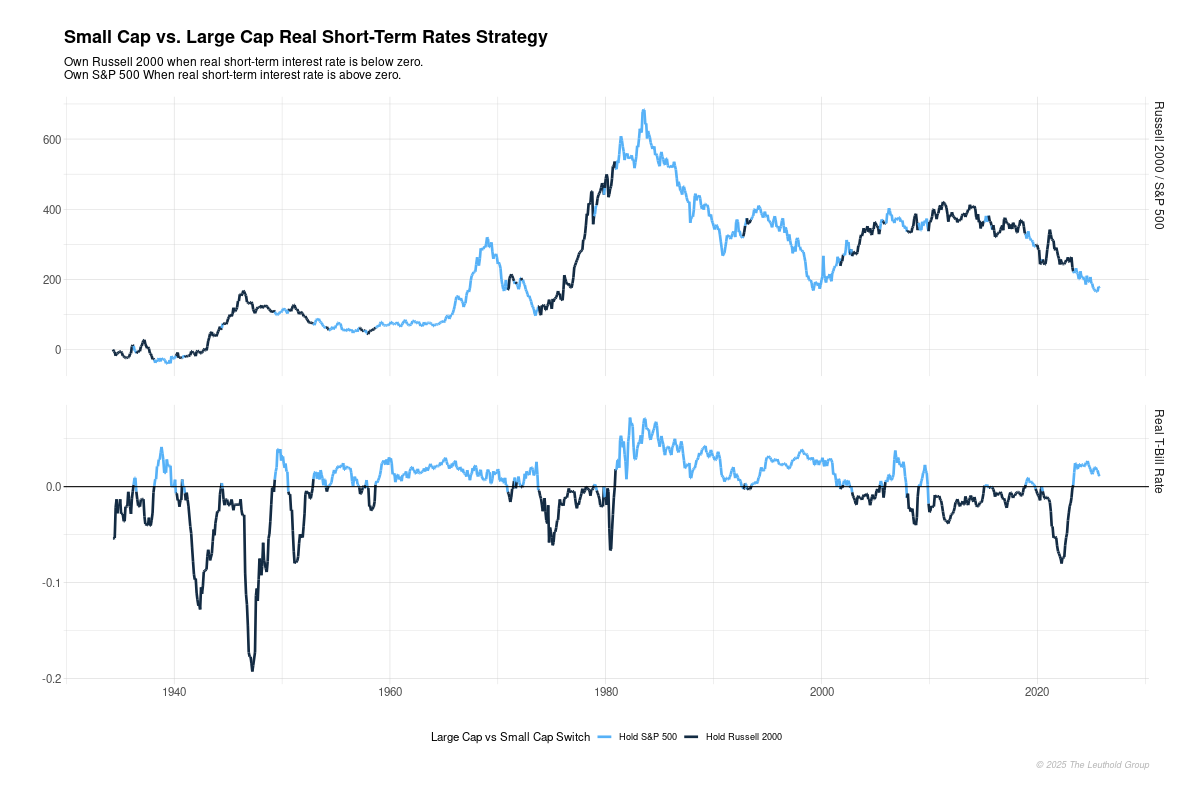
Small-cap stocks tend to be more sensitive to economic conditions because smaller companies often have less access to capital, are more growth-oriented, and are more affected by changes in borrowing costs. When real short-term interest rates are above zero, it typically indicates a stronger economy with rising interest rates, which might benefit small caps as they can capitalize on growth opportunities.
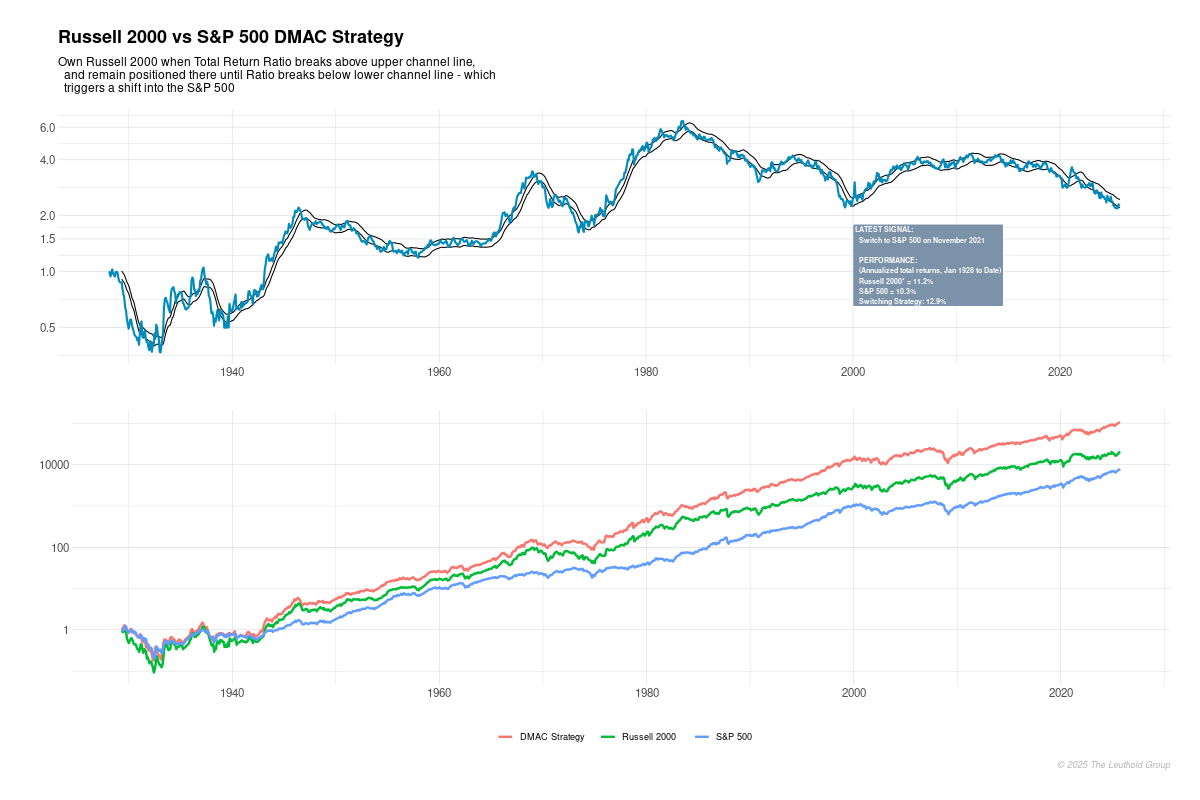
The strategy monitors the Russell 2000/S&P 500 total return ratio to determine whether to allocate investments to small-cap stocks or large-cap stocks. Specifically, it uses a 15-month moving average of this ratio, creating an upper and lower channel that is 5% above and below the moving average, respectively. Signal to Buy Russell 2000: When the total return ratio (Russell 2000/S&P 500) rises above the upper channel line, it indicates strong momentum in small-cap stocks. The strategy then allocates to the Russell 2000, positioning the portfolio to benefit from continued small-cap outperformance. Holding Position: The portfolio remains invested in the Russell 2000 as long as the ratio stays within the upper half of the channel. This allows the strategy to capture extended periods of small-cap strength.Signal to Shift to S&P 500: If the total return ratio falls below the lower channel line, it signals a shift in momentum, suggesting that large-cap stocks may begin to outperform. At this point, the strategy reallocates the portfolio to the S&P 500, positioning it defensively.Risk Management: The strategy avoids frequent reallocations by only reacting to substantial breaks of the upper and lower channel lines, thereby reducing transaction costs and minimizing the impact of short-term market noise.
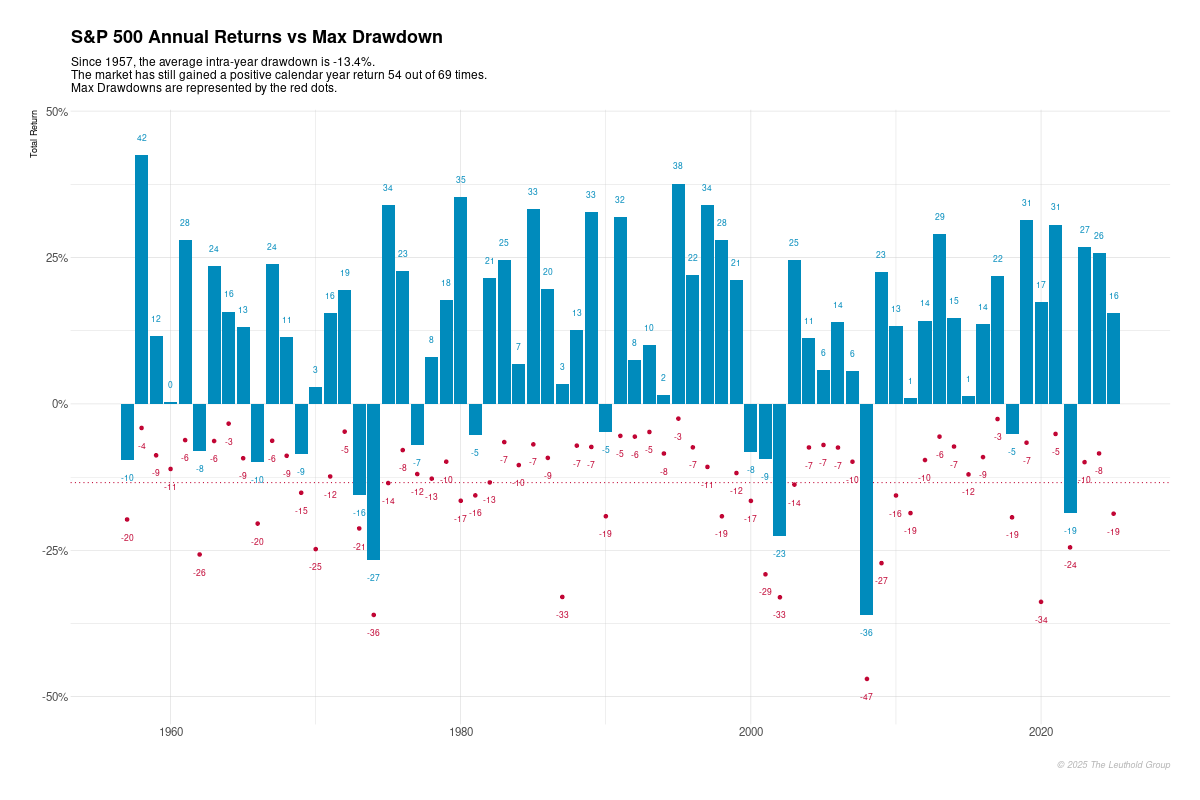
This chart provides a comprehensive view of the S&P 500's annual total returns alongside the maximum drawdown experienced within each calendar year. The annual return bars highlight the market's performance for the year, while the overlayed drawdown markers show the most significant peak-to-trough decline during that period. This dual perspective offers valuable insight into market volatility and risk. It demonstrates how years of strong performance can still experience substantial intra-year declines, underscoring the importance of managing emotions and maintaining a long-term investment focus. Similarly, it highlights how recovery often follows periods of significant drawdown, reinforcing the market’s historical resilience.
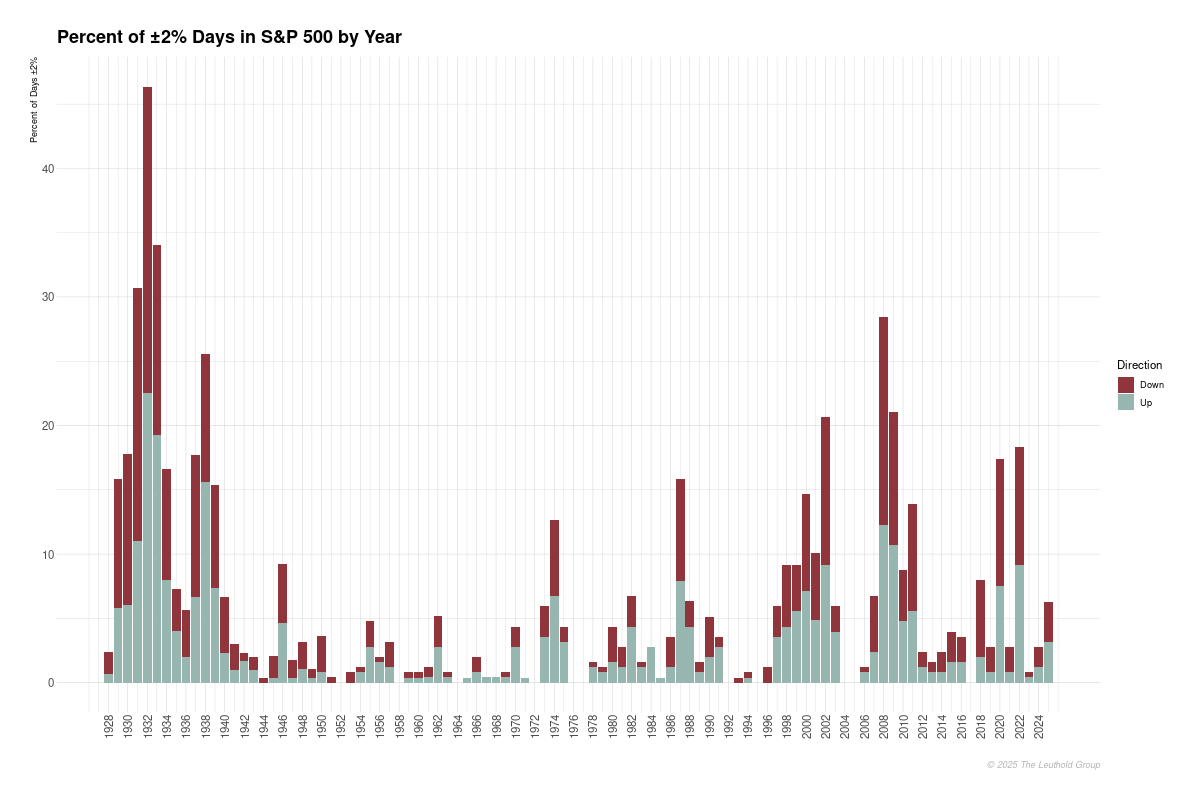
This chart shows the percentage of trading days each year where the S&P 500 moved 2% or more, either up (green) or down (red). It highlights periods of high market volatility, such as during major financial crises, wars, or economic shifts. Taller bars indicate years with more large daily moves, reflecting greater investor uncertainty and market turbulence.